The Price of Cardano (ADA) and Its Crucial Support Area
You may have noticed that the price of Cardano (ADA) is currently trading within a crucial horizontal support area at $0.25. This support area has been in place since the beginning of the year, indicating its significance.
However, determining the future trend’s direction is challenging at the moment. The readings from the weekly and daily timeframes are mixed, making it difficult to predict the price movement until there is a decisive break in one direction.
Cardano Price Analysis: Hovering Above Support
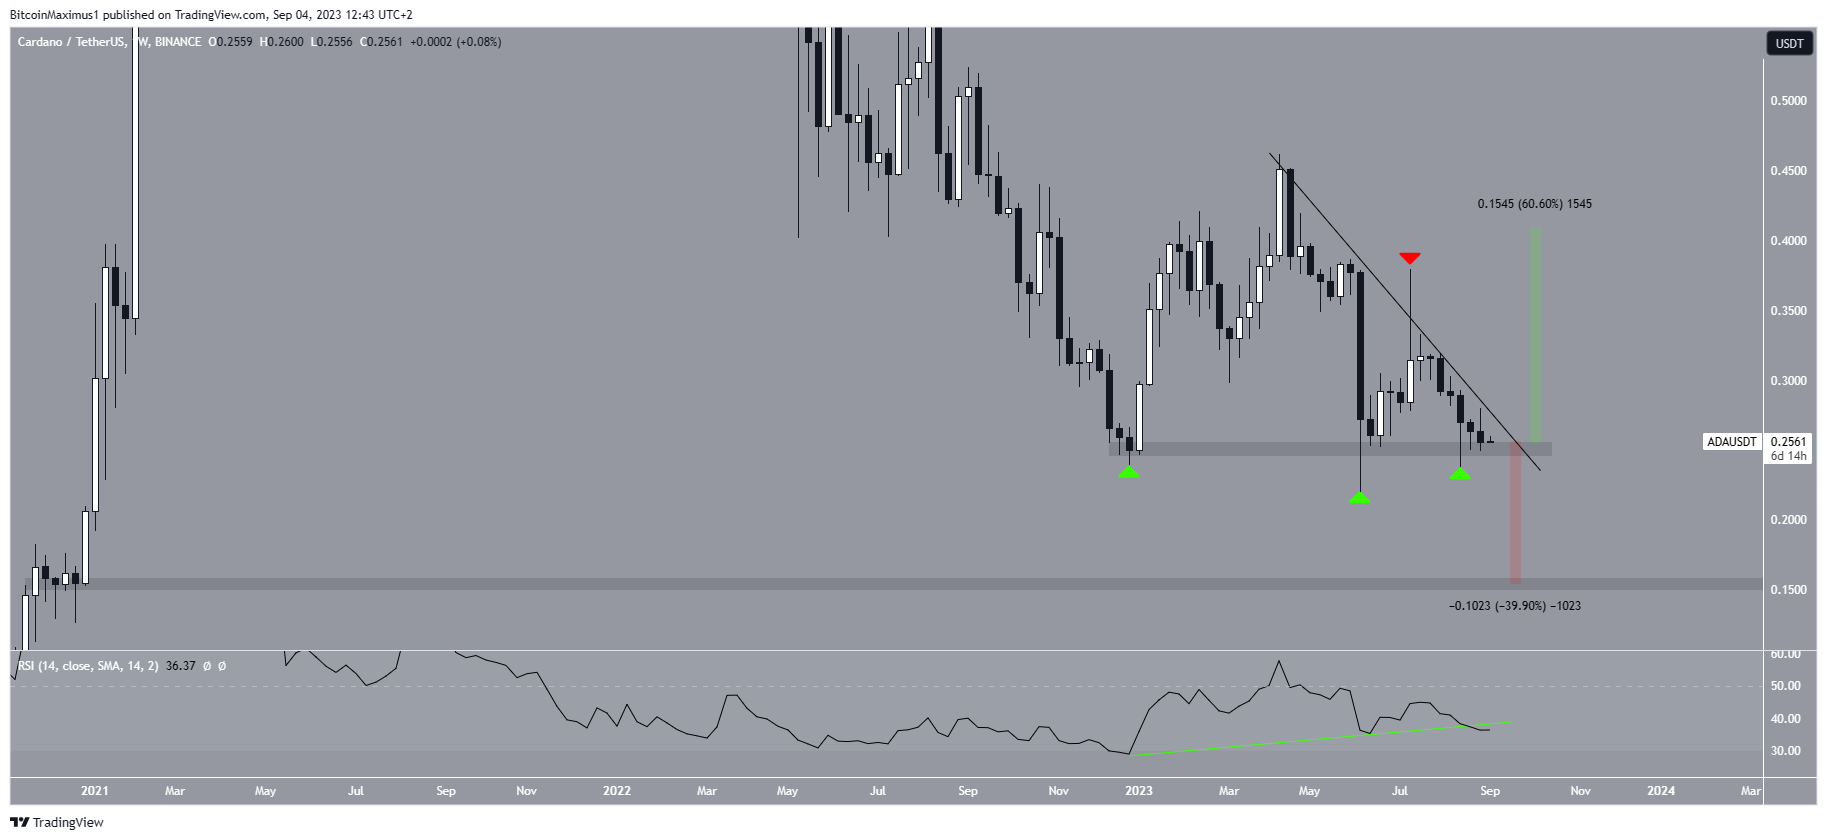
Let’s take a closer look at the technical analysis from the weekly timeframe. ADA is currently hovering just above the $0.25 horizontal support area, which has remained strong throughout the year.
When analyzing the price action within this area, conflicting signs emerge. On the bullish side, ADA seems to have formed a triple bottom pattern, which is typically considered a bullish signal that may result in a significant upward movement.
Conversely, the price has also fallen below a descending resistance line since May, with the line rejecting the price in July. This rejection, along with the $0.25 support area, creates a descending triangle pattern, which is generally seen as bearish.
Additionally, the weekly RSI (Relative Strength Index) is currently undetermined. Traders often use the RSI as a momentum indicator to assess whether a market is overbought or oversold, helping them decide whether to accumulate or sell an asset.
If the RSI reading is above 50 and the trend is upward, the bulls hold an advantage. However, if the reading is below 50, it indicates a bearish trend. Although the RSI has shown bullish divergence, its trendline is at risk of breaking down, and it currently sits below 50, suggesting a bearish trend.

Therefore, it is crucial to observe whether the price breaks out from the resistance line or breaks down below the $0.25 area, as this will determine the future trend’s direction.
A breakout from the resistance line could lead to a 60% increase towards the $0.42 resistance area, while a breakdown below $0.25 could initiate a 40% drop towards the next closest support at $0.15.
ADA Price Prediction: Bulls or Bears?
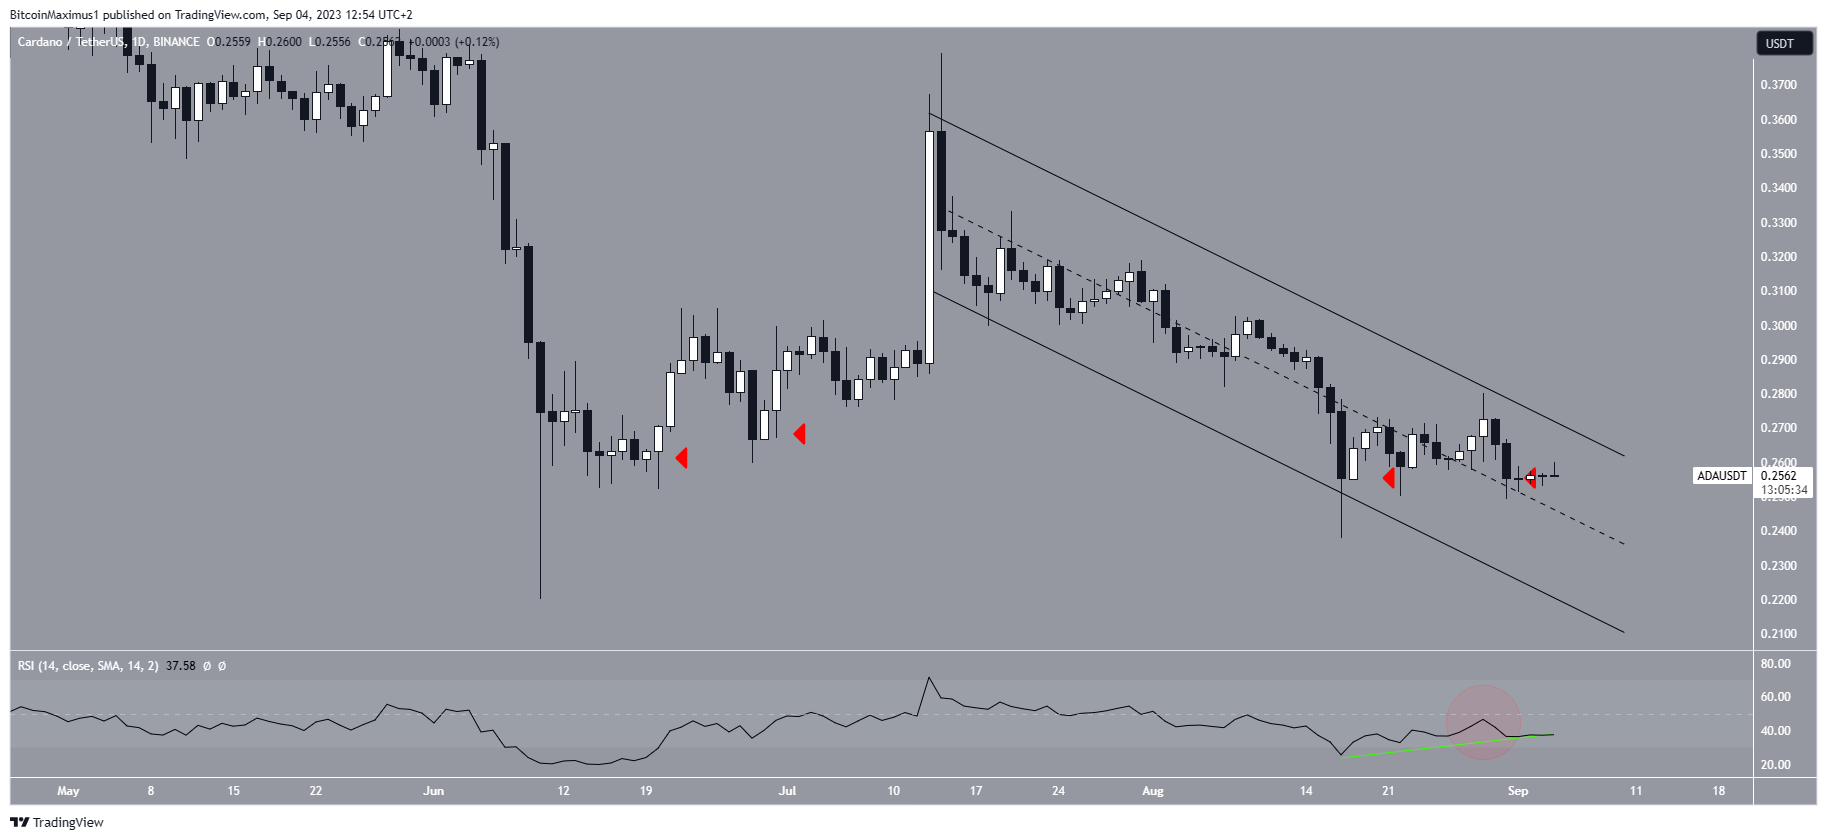
Now, let’s dive into the daily timeframe analysis, which provides a mixed perspective due to both the price action and RSI readings.
On the bearish side, the progressive lower closes since June indicate that bulls are losing momentum, resulting in gradually lower closing prices. On the bullish side, there is a descending parallel channel, which often contains corrective movements and suggests an eventual breakout.
The daily RSI also presents mixed signals. On one hand, the indicator is below 50 and decreasing, indicating a bearish trend. On the other hand, it has generated a bullish divergence, adding to the ambiguity in determining the trend’s direction.

In conclusion, the ADA price prediction relies on whether the price breaks out from the long-term resistance line or breaks down below the $0.25 area. These decisive movements will determine the future trend’s direction.
A breakout from the resistance line could result in a 60% increase, while a breakdown from $0.25 may cause a 40% fall.
A Hot Take on Cardano’s Future
As the price of Cardano (ADA) hovers around a crucial support area and conflicting signals emerge, it’s clear that bulls and bears are engaged in a battle for control. The outcome of this battle will determine ADA’s future trajectory.
Will the bulls succeed in breaking through the resistance line and pushing the price higher, or will the bears prevail and drive the price down below $0.25? Only time will tell.
One thing is certain: Cardano’s future is hanging in the balance, and investors and traders should closely monitor the price movements and key levels to make informed decisions.


 By
By
 By
By
 By
By

 By
By