Flamingo Finance (FLM) Price: Analyzing the Recent Movement
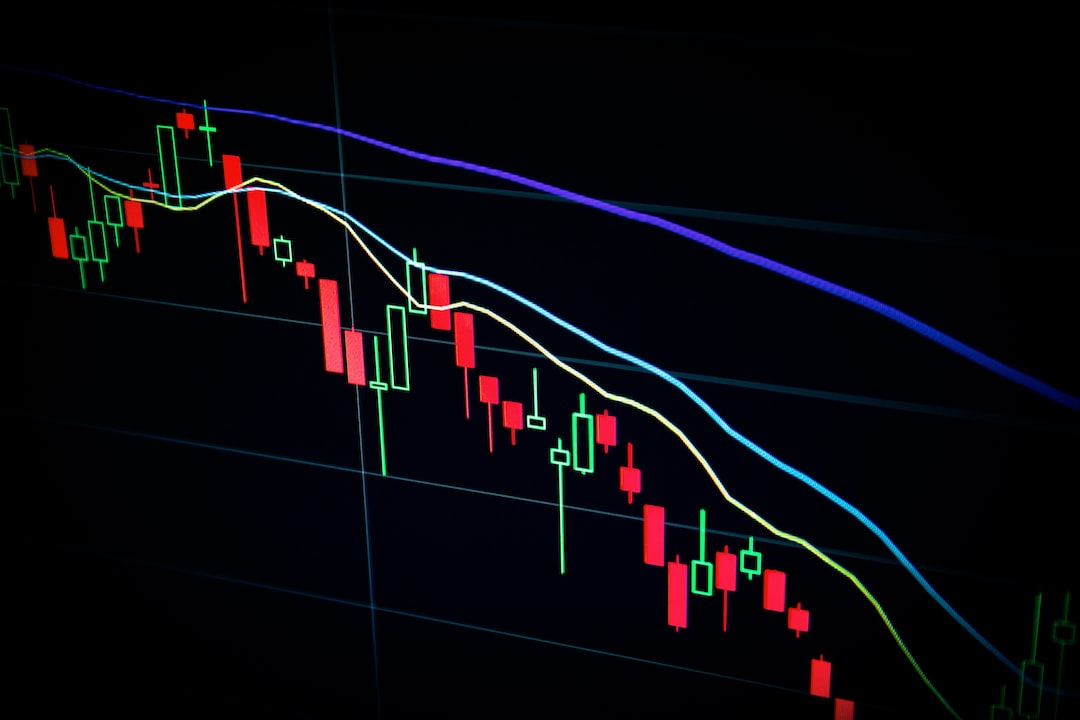
You have witnessed a 200% increase in the Flamingo Finance (FLM) price on September 4 and 5, followed by a subsequent fall. This fall has confirmed the presence of a diagonal and horizontal resistance level. Despite this decrease, the readings on the weekly and daily timeframes suggest the potential for a future breakout.
The Flamingo Finance Price’s Failed Attempt at Breakout
Since April 2022, the FLM price has been trading below a descending resistance line. Although the price has breached the line multiple times, it has been unable to close above it. These movements have resulted in long upper wicks, indicating selling pressure. However, each touch weakens the line, increasing the likelihood of an eventual breakout.
Turning Bullish: Analyzing the Weekly RSI
The weekly Relative Strength Index (RSI) is showing signs of turning bullish. As a momentum indicator, the RSI helps traders determine whether a market is overbought or oversold, influencing their decisions to accumulate or sell an asset. Readings above 50 and an upward trend indicate an advantage for the bulls, while readings below 50 suggest the opposite.
Bullish Divergence and a Promising Trend
The RSI has displayed bullish divergence, where a momentum increase accompanies a price decrease. This often precedes upward movements. Additionally, the RSI is approaching the 50 mark, indicating a potential bullish trend.
Price Prediction: Potential Breakout or Drop
If the FLM price successfully breaks out, it could see a 250% increase, reaching the next resistance level at $0.290. However, failure to do so may result in a 50% drop towards a descending support line at $0.040.
When Will the Breakout Occur?
An analysis of the daily timeframe reveals a 200% increase in the FLM price between September 4 and 5. The trading volume spiked to its highest levels since June 2022 during this period. Furthermore, the FLM social dominance metric reached its peak in 5 weeks.
However, the rate of increase could not be sustained, and the price fell below the $0.120 horizontal resistance area. Despite this, FLM is still trading above an ascending support line since June. The daily RSI remains bullish, being above 50.
Considering these factors, the most likely FLM price prediction involves a breakout from the descending resistance line and $0.120 area, potentially leading to an increase towards the next resistance at $0.290. On the other hand, a breakdown from the ascending support line would invalidate this bullish forecast and may result in a drop to the closest support at $0.040.
Hot Take
The Flamingo Finance (FLM) price has shown signs of potential breakout and bullish momentum. However, it is important to carefully monitor the price movement and consider the support and resistance levels before making any investment decisions. Stay informed and analyze the market trends to make well-informed crypto investment choices.


 By
By
 By
By
 By
By
 By
By
 By
By
 By
By