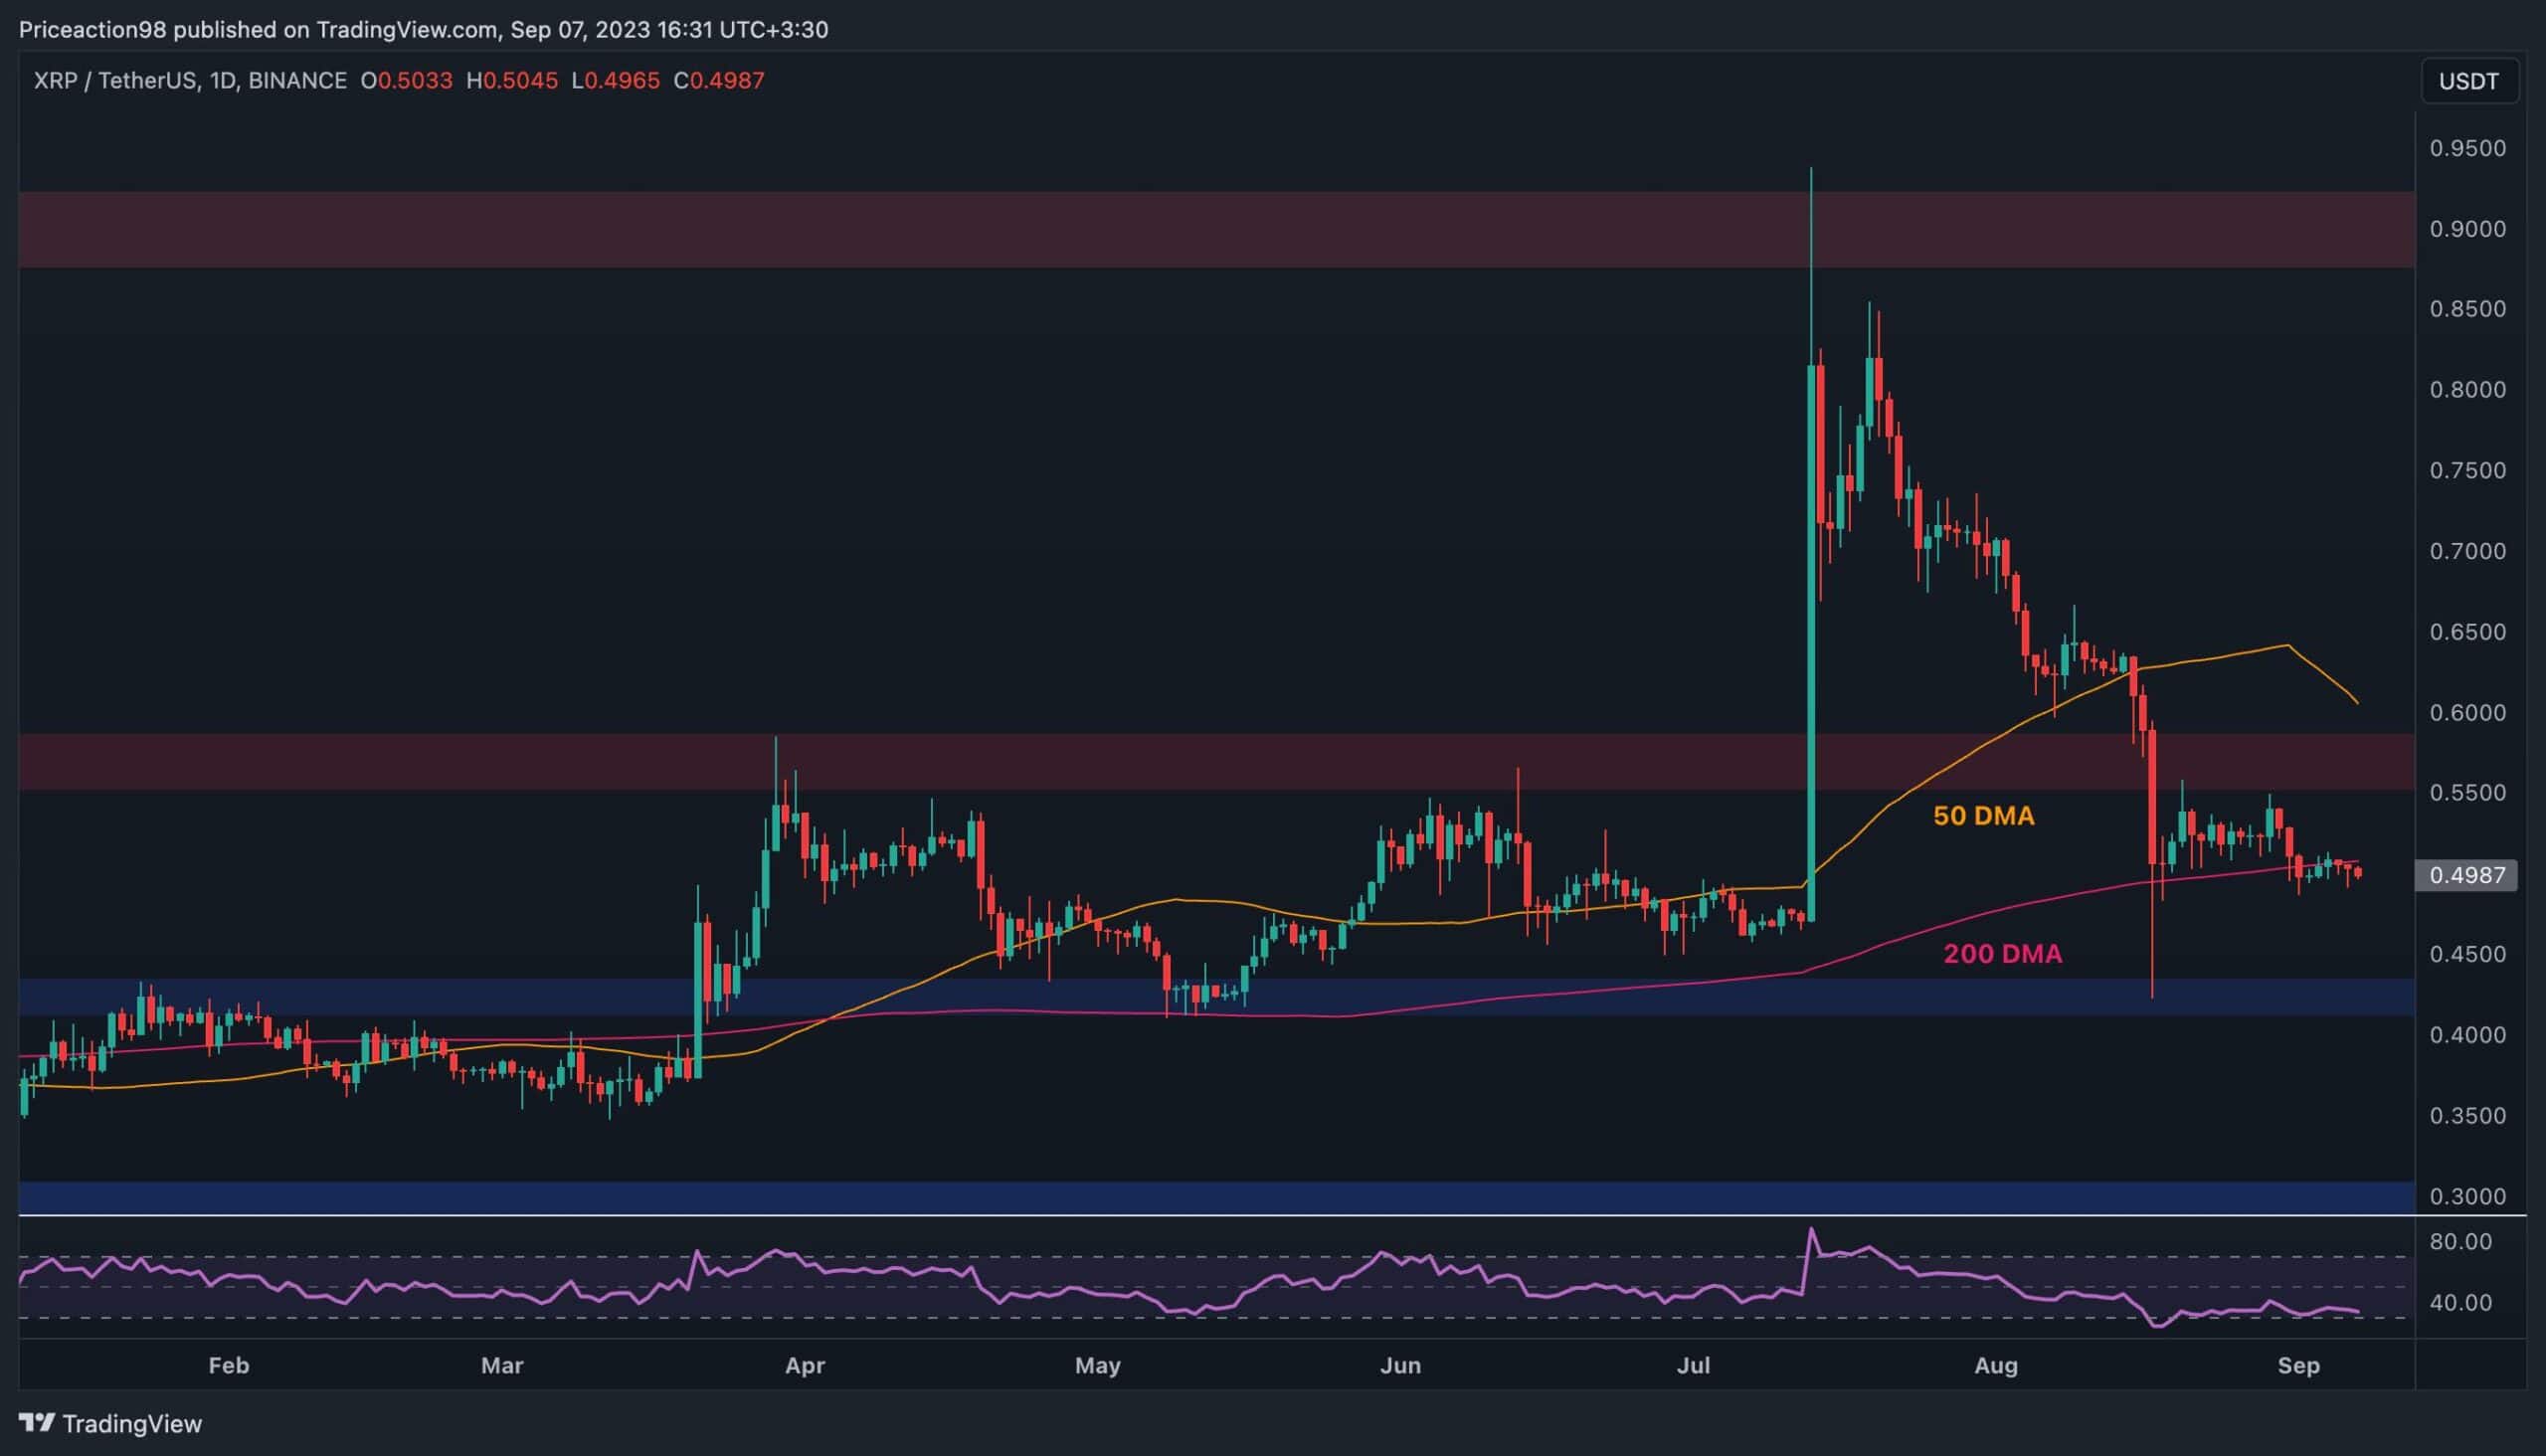
XRP’s value has been gradually decreasing recently, and the current situation does not appear to be in favor of XRP.
Technical Analysis
By Edris
Analyzing the USDT-Paired Chart
When examining the USDT-paired chart, you can observe that the price is struggling to recover following a recent drop from the $0.9 resistance level. Additionally, the market is not finding support from the 200-day moving average, which is situated around the $0.5 mark, as the price has consistently closed below it in recent days.
Considering the current market structure and the RSI indicator’s values being significantly below 50%, there is a high probability of the price declining towards the $0.43 support level in the near future.
Analyzing the BTC-Paired Chart
When examining the BTC-paired chart, we can observe similarities to the USDT-paired chart. Although the 200-day moving average remains intact at around the 1850 SAT level, the price is forming lower highs and lows, indicating a bearish market structure.
If the 200-day moving average and the 1800 SAT support level are breached downwards, Ripple’s situation will worsen, potentially causing the price to quickly drop towards the 1500 SAT range.
Hot Take
The decline in Ripple’s price, along with the bearish market structure and technical indicators, suggests a challenging period for XRP. It is essential for you, as a crypto reader, to closely monitor the market developments and be prepared for potential further declines in XRP’s value.


 By
By
 By
By
 By
By
 By
By
 By
By
 By
By