Technical Analysis
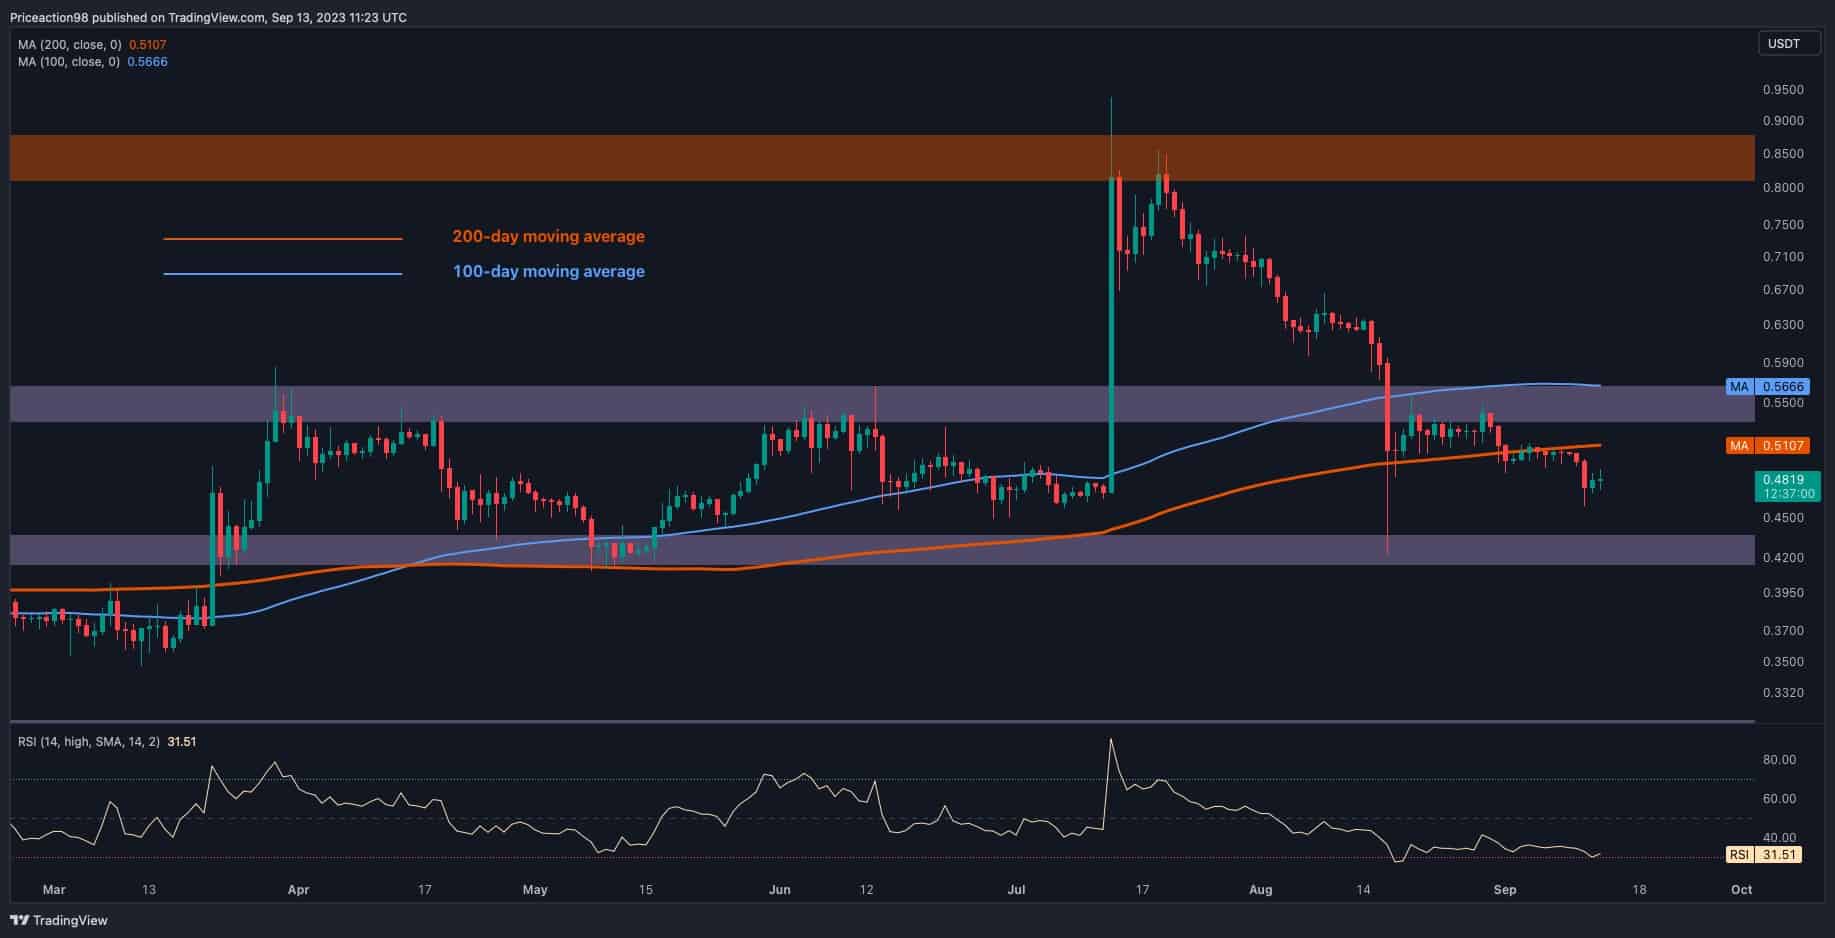
After a period of relatively calm price movements, Ripple has finally broken below the crucial support zone represented by the 200-day moving average. This indicates a clear bearish outlook for Ripple’s trajectory.
The Daily Chart
A closer look at the daily chart shows that Ripple went through a consolidation phase for several weeks after rebounding above the 200-day MA in mid-August. During this consolidation period, the price remained near the 200-day MA at around $0.51.
However, sellers gained the upper hand as supply exceeded demand, leading to increased selling pressure and a drop below the 200-day MA. The breach of this MA confirms the prevailing bearish sentiment in the market and suggests the potential for further downward movement.
While a small upward retracement towards the broken MA is possible, the overall outlook for Ripple is bearish. The next critical support level to watch is at $0.42. The upcoming price action will be crucial in determining Ripple’s future path.

The 4-Hour Chart
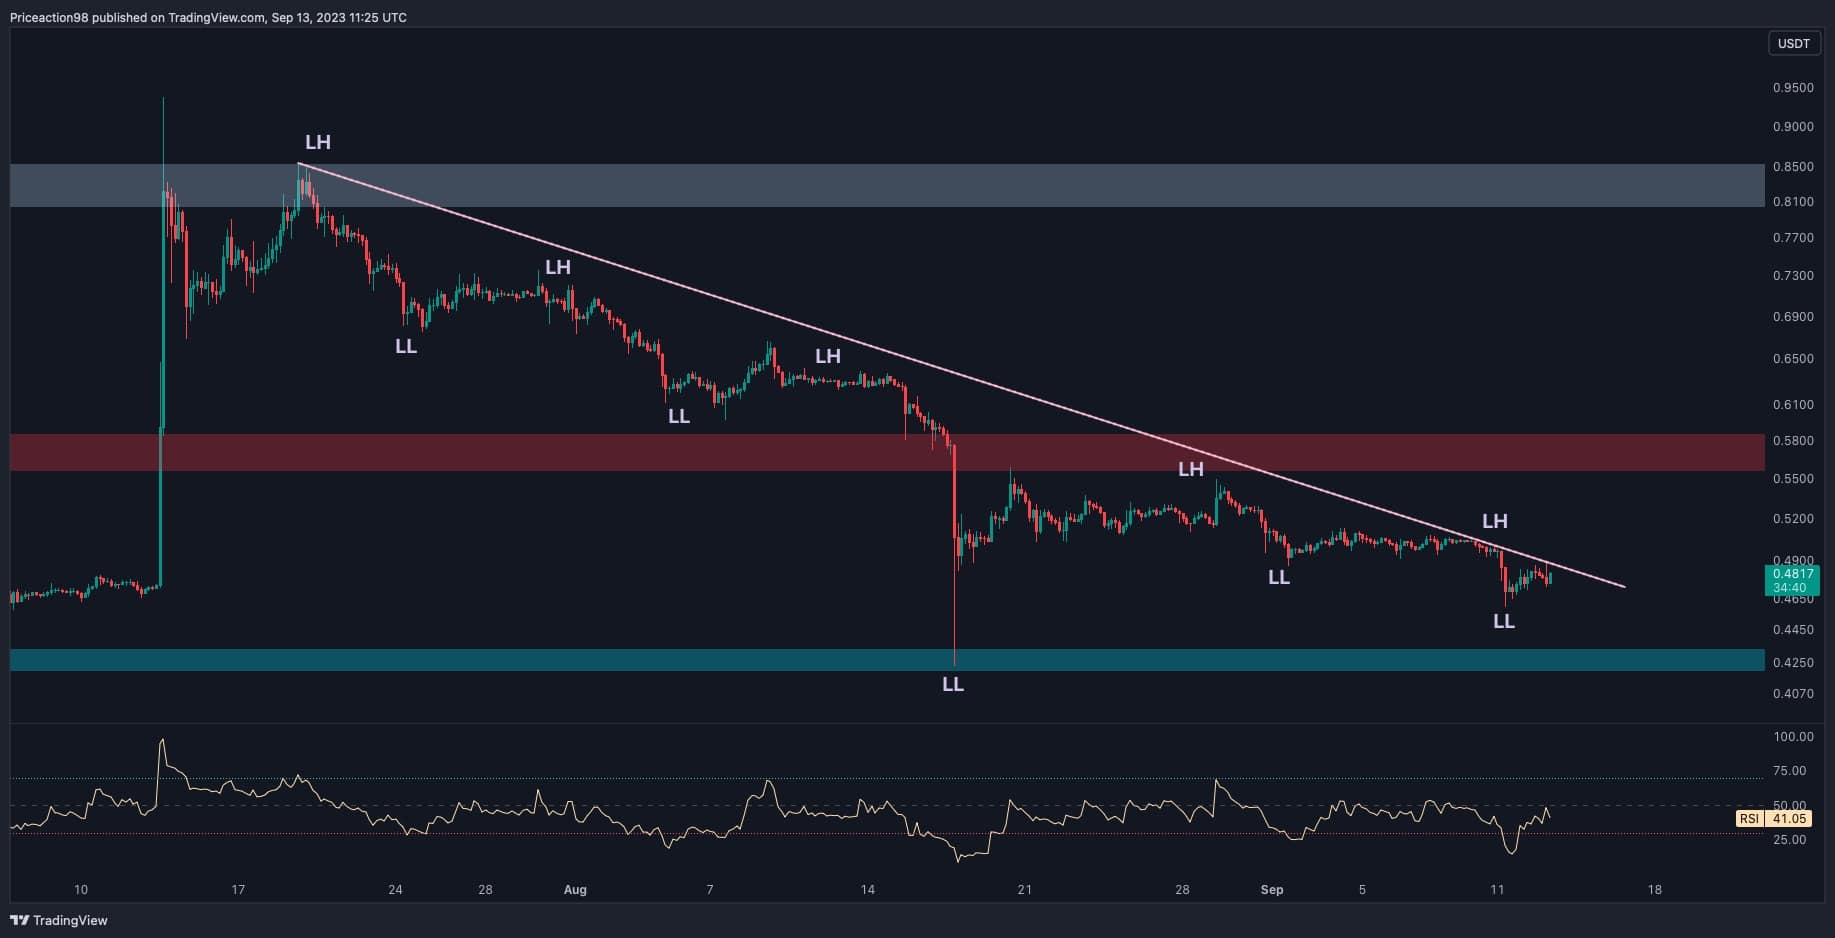
Looking at the 4-hour chart, we can see a well-defined downtrend in Ripple’s price over several months, characterized by lower highs and lower lows. These downward price swings indicate a strong downtrend.
The price is currently challenging a descending trendline that has been in place for several months. Given that this trendline acts as a resistance zone, it is likely that there will be a rejection, leading to further bearish movement and the possibility of forming a new lower low.
However, if buyers manage to keep the price near the trendline and push it above, the scenario could turn bullish. It’s important to note that this breakout will only be confirmed once the price retraces to retest the breached trendline and forms a pullback. If this happens, XRP could potentially move towards higher price levels, with a possible surge towards the static support at $0.55.
Regardless of the outcome, it is essential to closely monitor price fluctuations as the interaction between support and resistance levels will greatly influence Ripple’s immediate price trajectory.

Hot Take: Ripple Faces Bearish Outlook as Price Breaks Key Support Level
Ripple’s recent price movements have signaled a bearish outlook for the cryptocurrency. After breaking below the critical support zone represented by the 200-day moving average, sellers have gained control and pushed the price lower. The breach of this support level confirms the prevalence of bearish sentiment in the market.
On the daily chart, Ripple went through a consolidation phase near the 200-day MA before dropping below it. The next key support level to watch is at $0.42. Meanwhile, on the 4-hour chart, Ripple has been in a well-defined downtrend, with a descending trendline acting as resistance. A break above this trendline could potentially turn the scenario bullish.
However, it is crucial to closely monitor price fluctuations and the interaction between support and resistance levels to determine Ripple’s immediate price trajectory.
The post Here Are Two Critical Levels to Watch as XRP Tumbles Below $0.48 (Ripple Price Analysis) appeared first on CryptoPotato.


 By
By
 By
By
 By
By

 By
By
 By
By