THORChain (RUNE) Breaks Resistance and Reaches New High
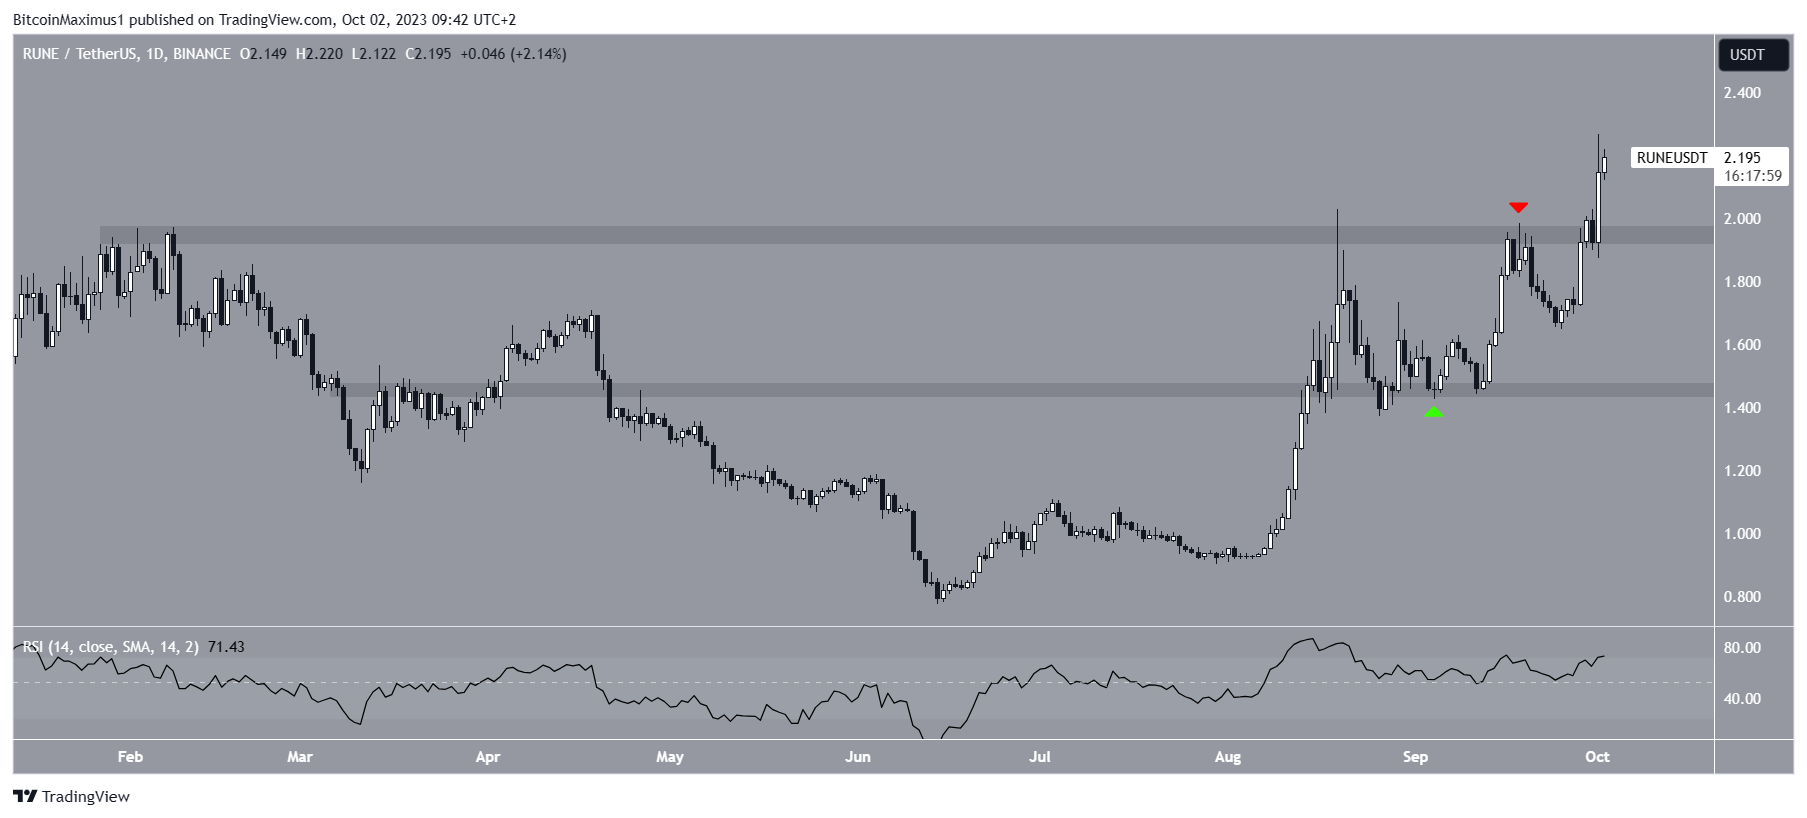
On October 1, THORChain (RUNE) surpassed the $1.95 resistance level and achieved a new yearly high of $2.27. This breakthrough occurred after the resistance had been in place since the beginning of the year.
Price Movement Indicates Future Trend
The price of RUNE has been increasing since it bounced off the $1.45 support area on September 4. The upward momentum accelerated on September 11, leading to a reach of the $1.95 range high on September 18.
When a cryptocurrency trades within a horizontal range, it consolidates between the high and low points before eventually breaking out of that range. The direction in which it breaks out determines the future trend.

Bullish Outlook Based on RSI
The daily Relative Strength Index (RSI) indicates a bullish outlook for RUNE. The RSI is a momentum indicator used by traders to determine whether an asset is overbought or oversold and make decisions accordingly.
If the RSI reading is above 50 and trending upwards, it suggests a bullish trend. In this case, the RSI is above 50 and showing an upward movement, indicating a favorable situation for bulls.
RUNE Price Prediction: Potential Peak
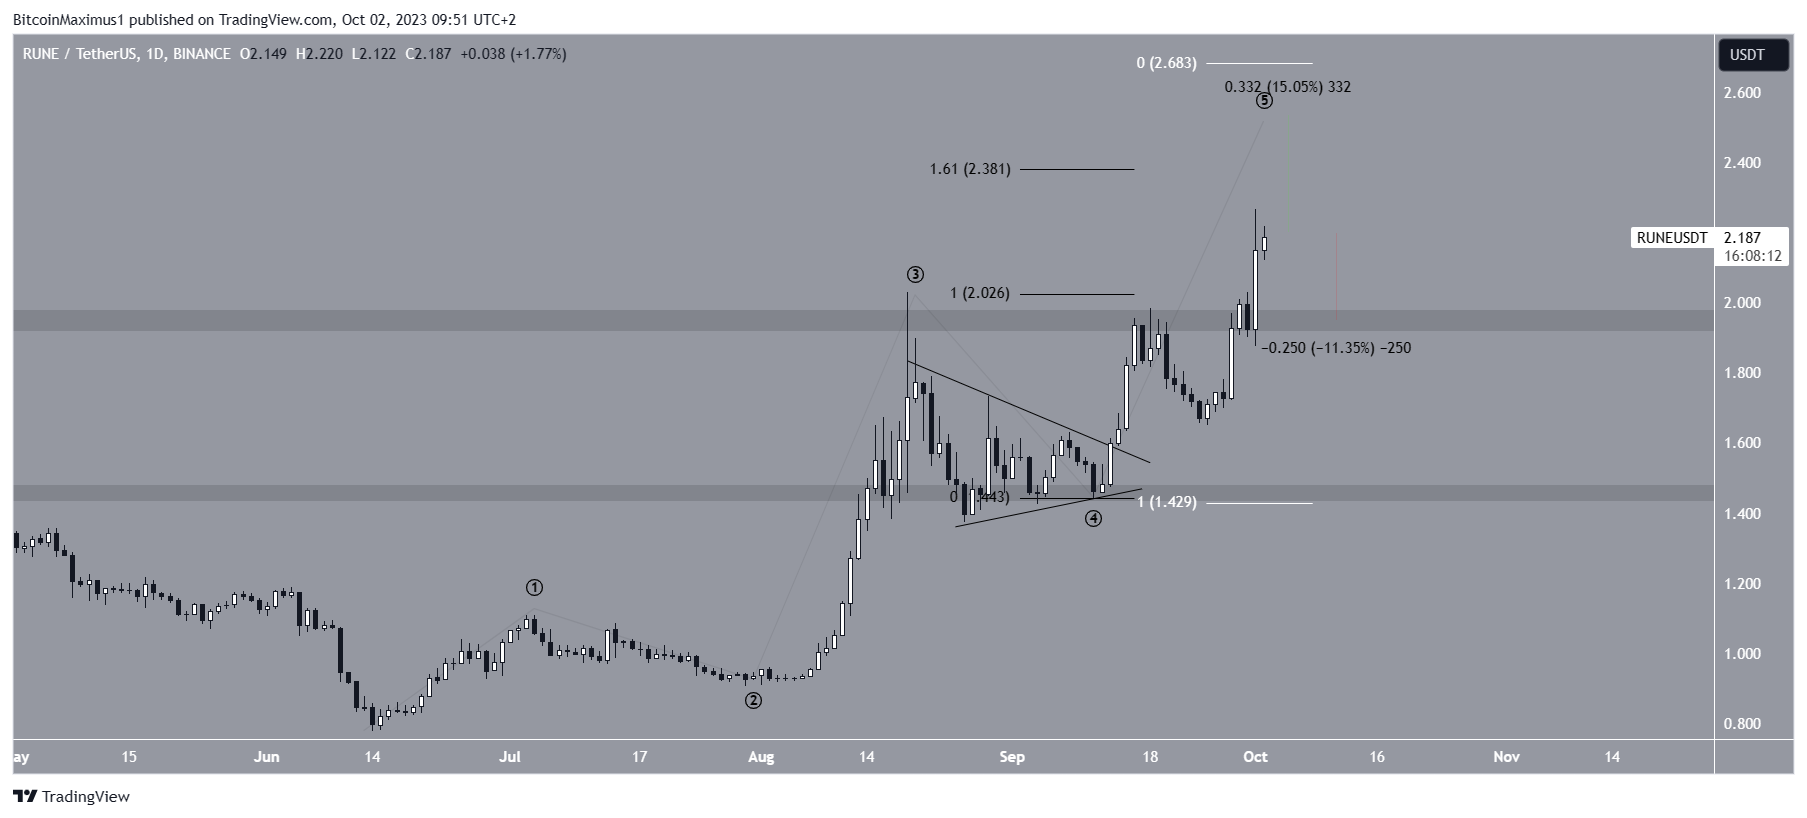
According to Elliott Wave theory, which identifies long-term price patterns and investor psychology, the RUNE price is currently in the fifth and final wave of an upward trend that began in June.
An important pattern in this wave is a symmetrical triangle formation, often observed in wave four positions. Based on this count, there is a possibility of the RUNE price continuing to rise to around $2.40 – $2.70, representing a 15% increase from its current value.

Considerations for Potential Loss of Momentum
While the prediction is bullish, it’s important to note that if there is a sudden loss of momentum, the price could drop back to the $1.95 area. This would indicate that the local top has been reached.
Hot Take: RUNE Breaks Resistance and Shows Bullish Momentum
THORChain’s (RUNE) recent breakout above the long-standing resistance level is a significant development. The price has reached a new yearly high, indicating strong bullish momentum. The RSI supports this outlook, suggesting that the upward trend may continue.
According to Elliott Wave theory, there is potential for further price appreciation, with a target range of $2.40 – $2.70. However, it’s essential to monitor any loss of momentum that could signal a reversal in the short term.


 By
By
 By
By
 By
By
 By
By
 By
By
 By
By