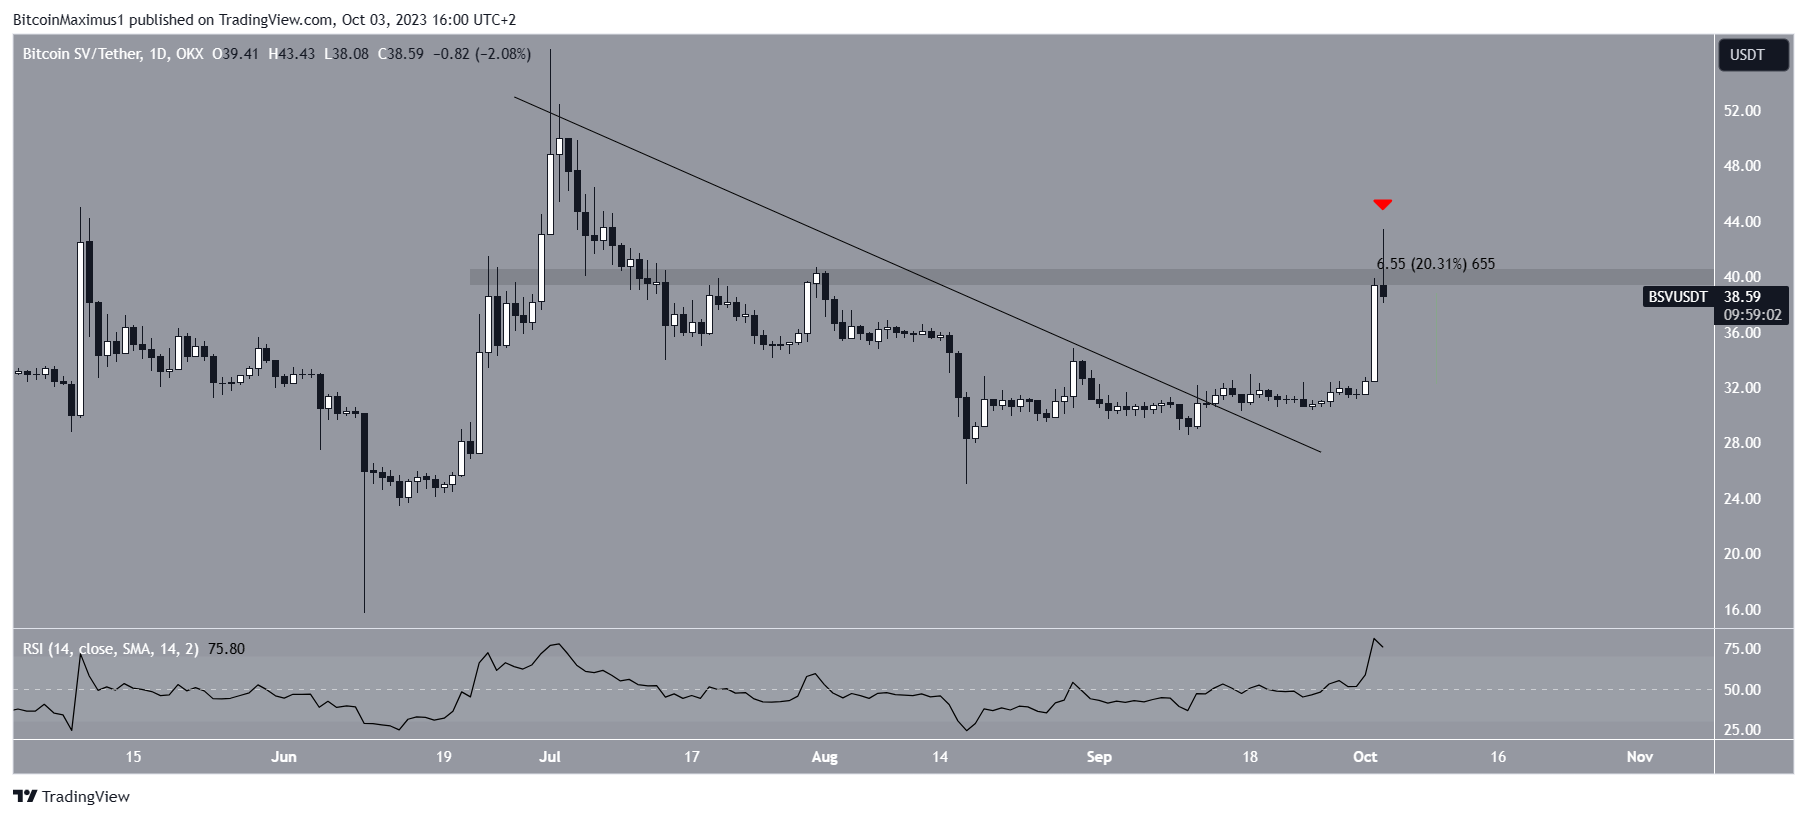
The Bitcoin SV (BSV) price broke out from a descending resistance trendline and increased by 20% on October 2.
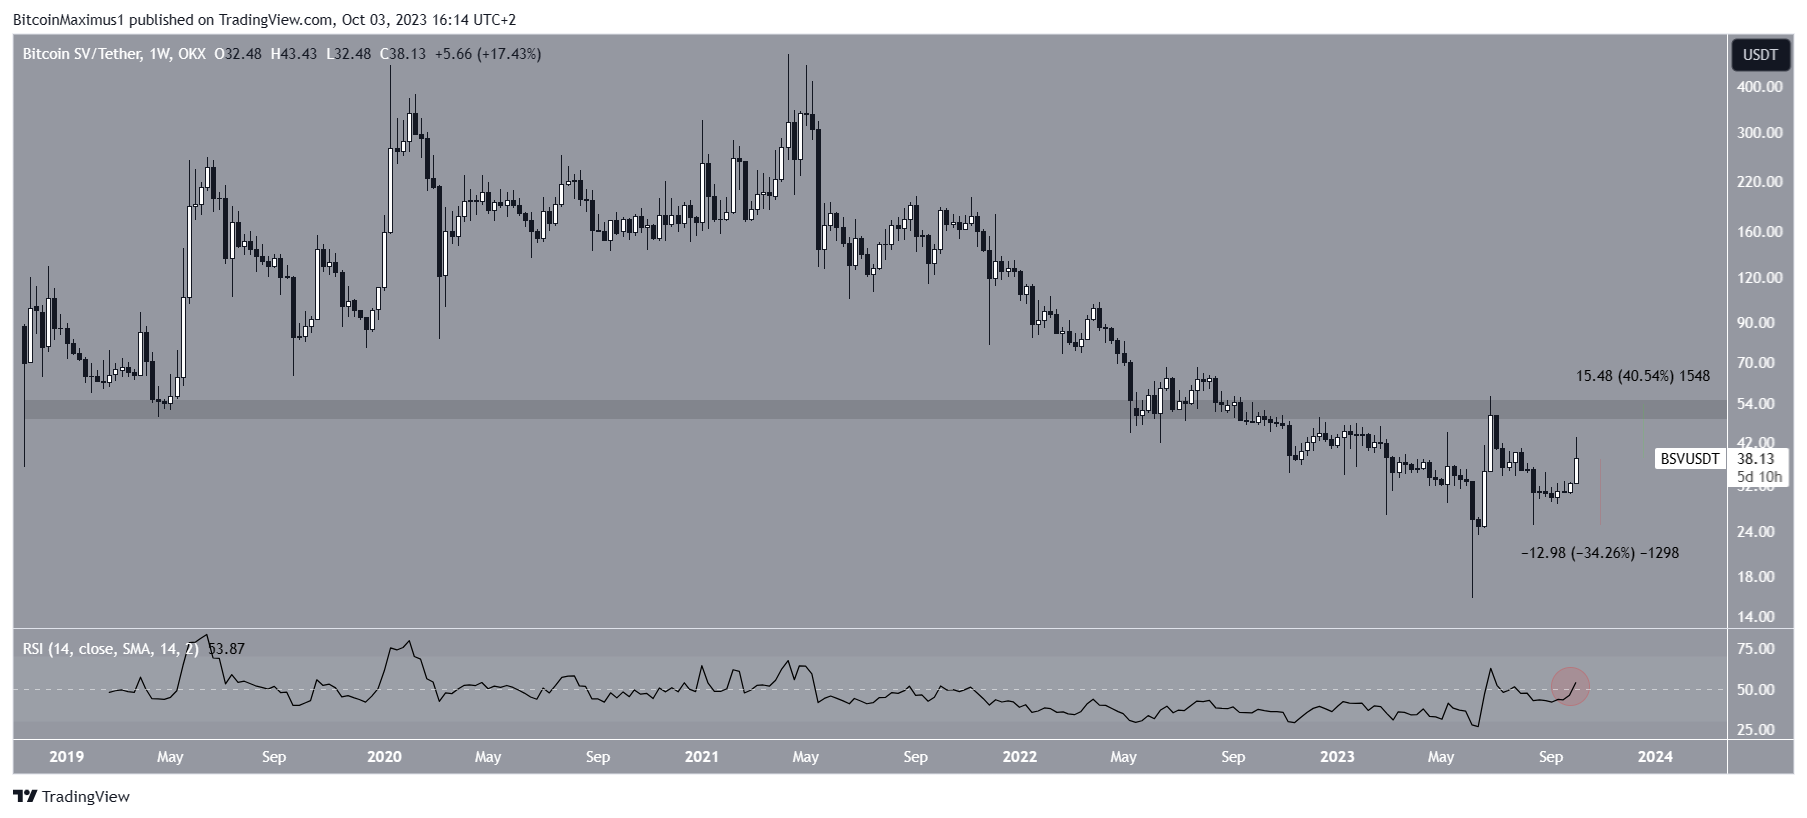
Despite the breakout, the price is still trading below the long-term horizontal resistance at $50.
Bitcoin SV Increases by 20%
Since July 1, the BSV price has been under a descending resistance trendline. On August 17, it reached a low of $25 before bouncing back. The price has been increasing since then.
On September 13, the price broke out from the descending resistance trendline. It continued to increase at an accelerated rate on October 2, with a 20% gain. However, the next day, it fell after reaching a high of $43.34, confirming the $40 area as resistance.

Despite the rejection at $40, the daily Relative Strength Index (RSI) remains bullish. The RSI is an important indicator for assessing momentum and determining whether a trend is bullish or bearish. Currently, the RSI reading is above 50 and increasing, indicating a bullish trend.
BSV Price Prediction: Is Increase a Sign of Things to Come?
While the daily timeframe shows a significant increase in BSV price, the longer-term weekly timeframe does not validate this bullishness. The price is still trading well below the $50 horizontal resistance area, which has acted as a significant support level in the past.
The RSI is currently at 50, which could potentially lead to a rejection. Therefore, unless the price closes above the $50 resistance area, the BSV price prediction remains bearish.

The closest support level for BSV is at $25, which is 35% below the current price. On the other hand, the price would need to close above $50 for a potential 40% increase.
Hot Take: BSV Price Outlook Remains Bearish
Despite the recent breakout and increase in price, Bitcoin SV (BSV) still faces strong resistance at $50. The long-term weekly timeframe does not support the bullish momentum seen on the daily chart. Unless BSV can surpass this resistance level and close above $50, the price prediction remains bearish. Traders should keep a close eye on the RSI, as a rejection at the 50 level could further confirm the bearish outlook. The closest support level is at $25, indicating potential downside risk. It’s important to stay informed and monitor price movements before making any investment decisions.


 By
By
 By
By
 By
By
 By
By
 By
By
 By
By