The Litecoin (LTC) price has dropped by 50% from its yearly high of $115 in July.
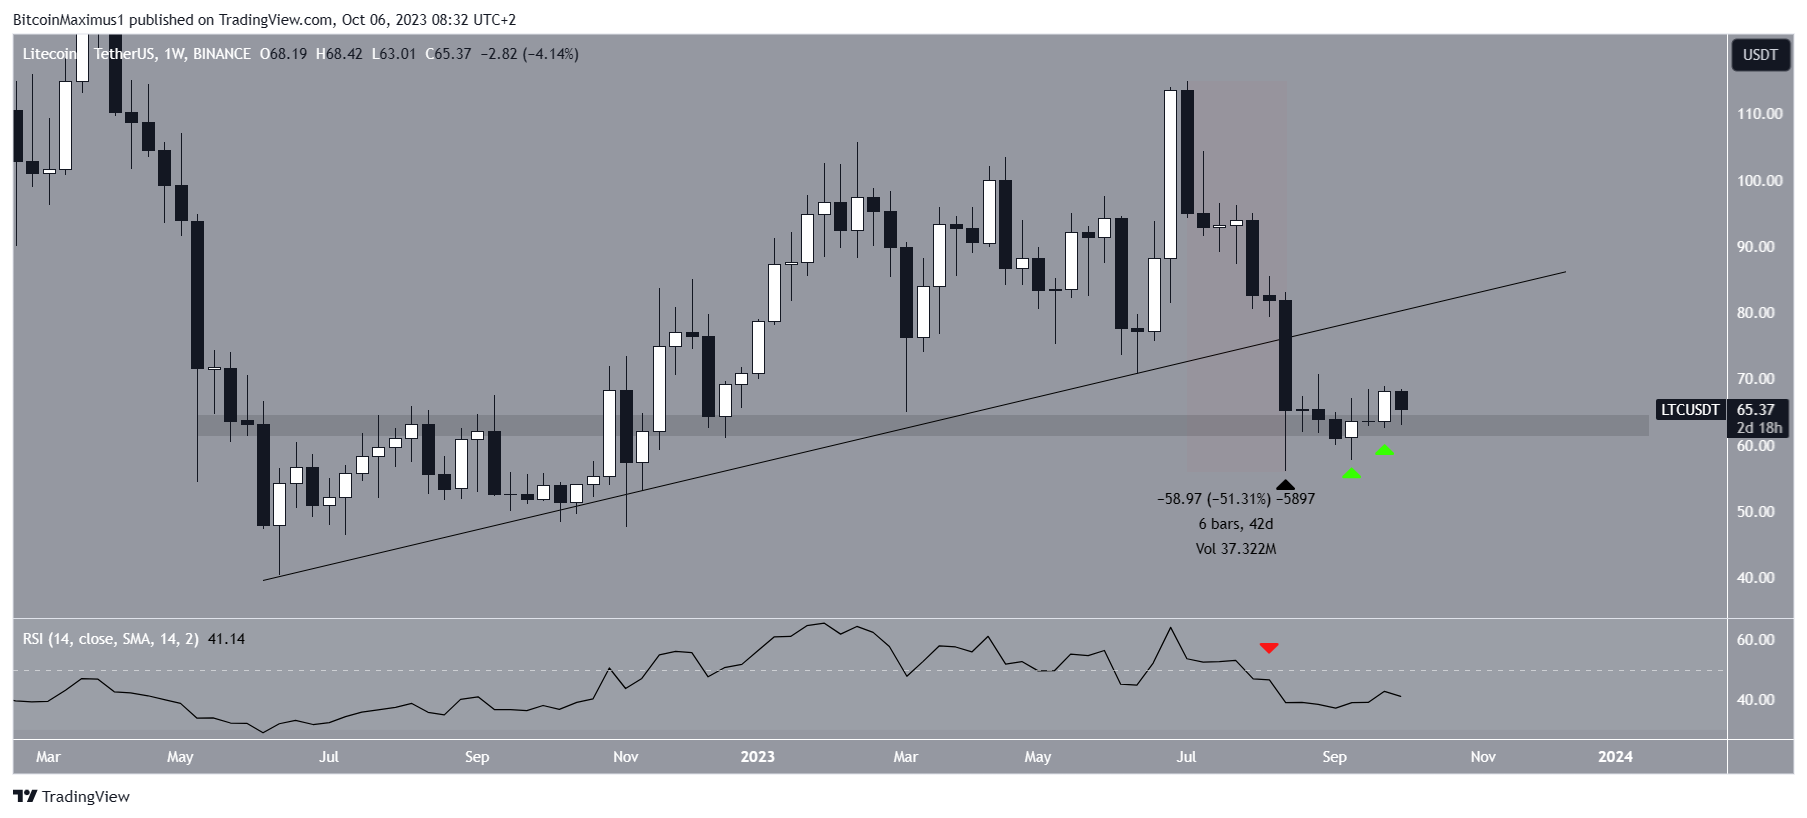
If you look at the long-term analysis, Litecoin experienced a decline after reaching a new yearly high. It broke through an ascending support trendline and hit a low of $56 in August, marking a 50% decrease from the high.
Litecoin Returns to Long-Term Range Low
Since hitting the low, LTC has been trading just above the $63 horizontal area. It initially bounced back after the low, showing that buyers were taking control. The cryptocurrency created two bullish candlesticks in September at this key support level.
However, there is a risk of a bearish candlestick forming this week. The weekly RSI is also bearish, indicating a downward trend.

To assess market momentum, traders often use the RSI. A reading above 50 with an upward trend favors bulls, while a reading below 50 indicates a bearish trend. Currently, the RSI for Litecoin is below 50 and falling, further supporting the bearish outlook.
Litecoin Price Prediction: Will a Breakout Occur?
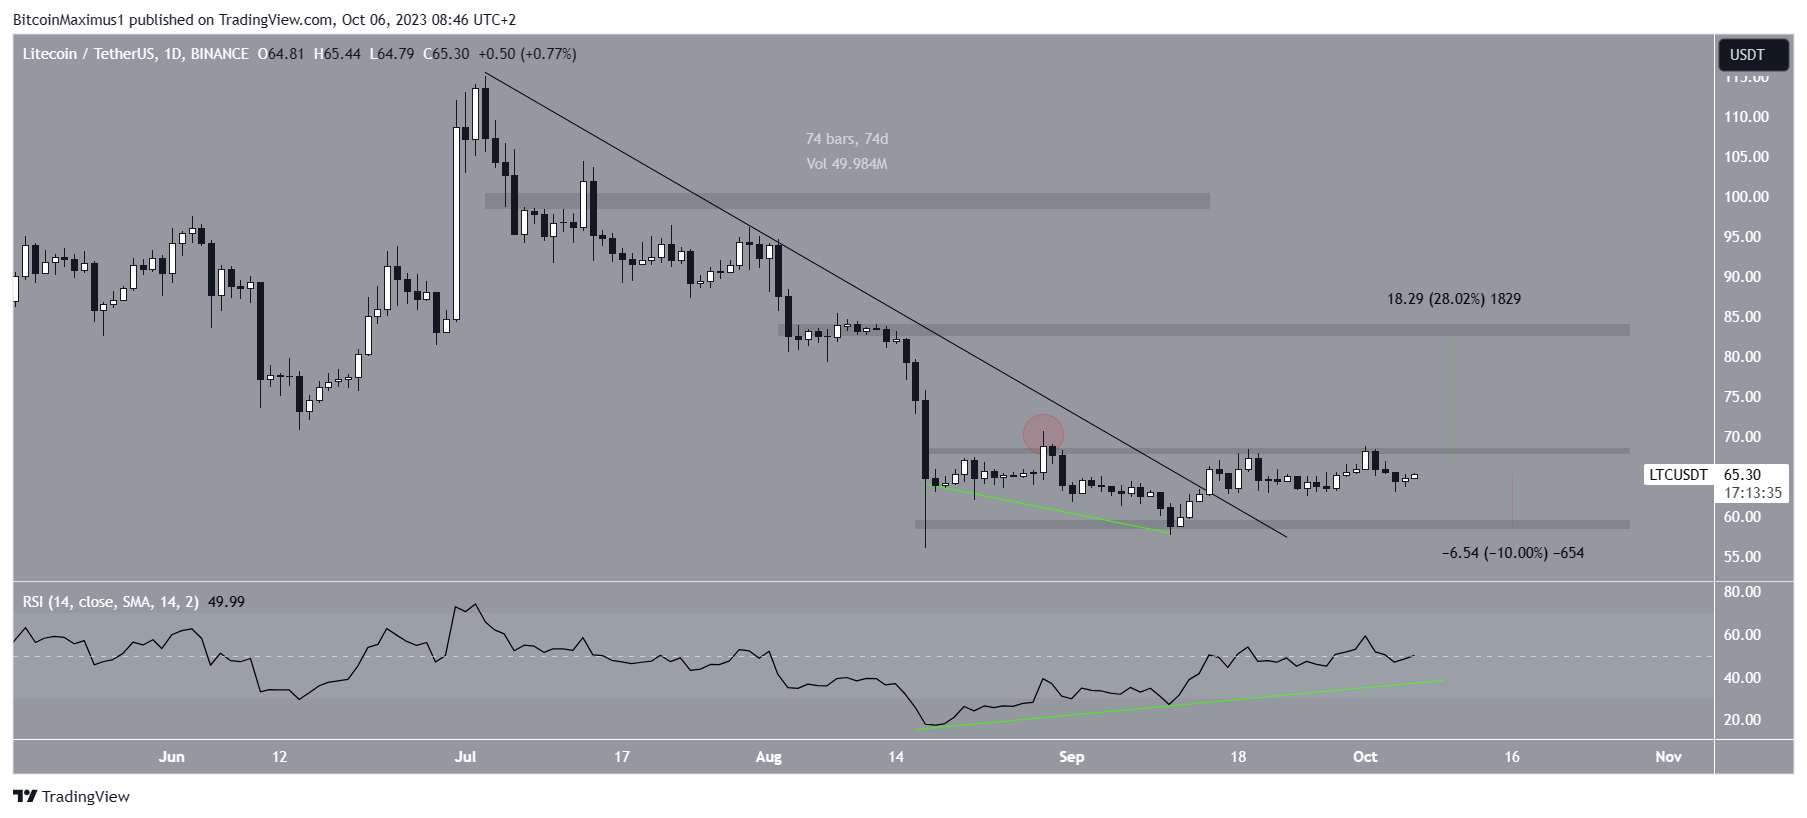
Looking at the daily timeframe, LTC’s price action is mixed. It fell below the $68 resistance area after briefly surpassing it, which is considered a bearish sign. However, it also broke out from a descending resistance trendline, suggesting the completion of the previous correction.
The daily RSI is bullish, showing a divergence between momentum and price decrease. This often leads to bullish reversals. Based on this, there is a slightly higher likelihood of Litecoin breaking out above the $68 resistance area and potentially reaching $85 as the next resistance level.

However, if Litecoin fails to break out from the $68 resistance area, a significant rejection could occur, leading to a 10% drop to the minor support at $59.
Hot Take: Litecoin’s Bearish Trend Continues
Despite some potential bullish signals, Litecoin’s price has been on a downward trend since reaching its yearly high in July. The recent bounce off the long-term support at $63 provides temporary relief, but the overall bearish sentiment remains.
Traders should closely monitor the RSI for any changes in momentum and watch for a potential breakout above the $68 resistance area. If Litecoin fails to break out, further downside movement is likely, with a possible drop to $59 as support.


 By
By
 By
By
 By
By

 By
By
 By
By