The Bancor (BNT) Price Struggles to Sustain Weekend Increase
The price of Bancor (BNT) saw a 70% increase over the weekend but has been unable to maintain its upward momentum. It has now fallen below the $0.62 horizontal resistance area, which has been in place since March.
Bancor Reaches Long-Term Resistance
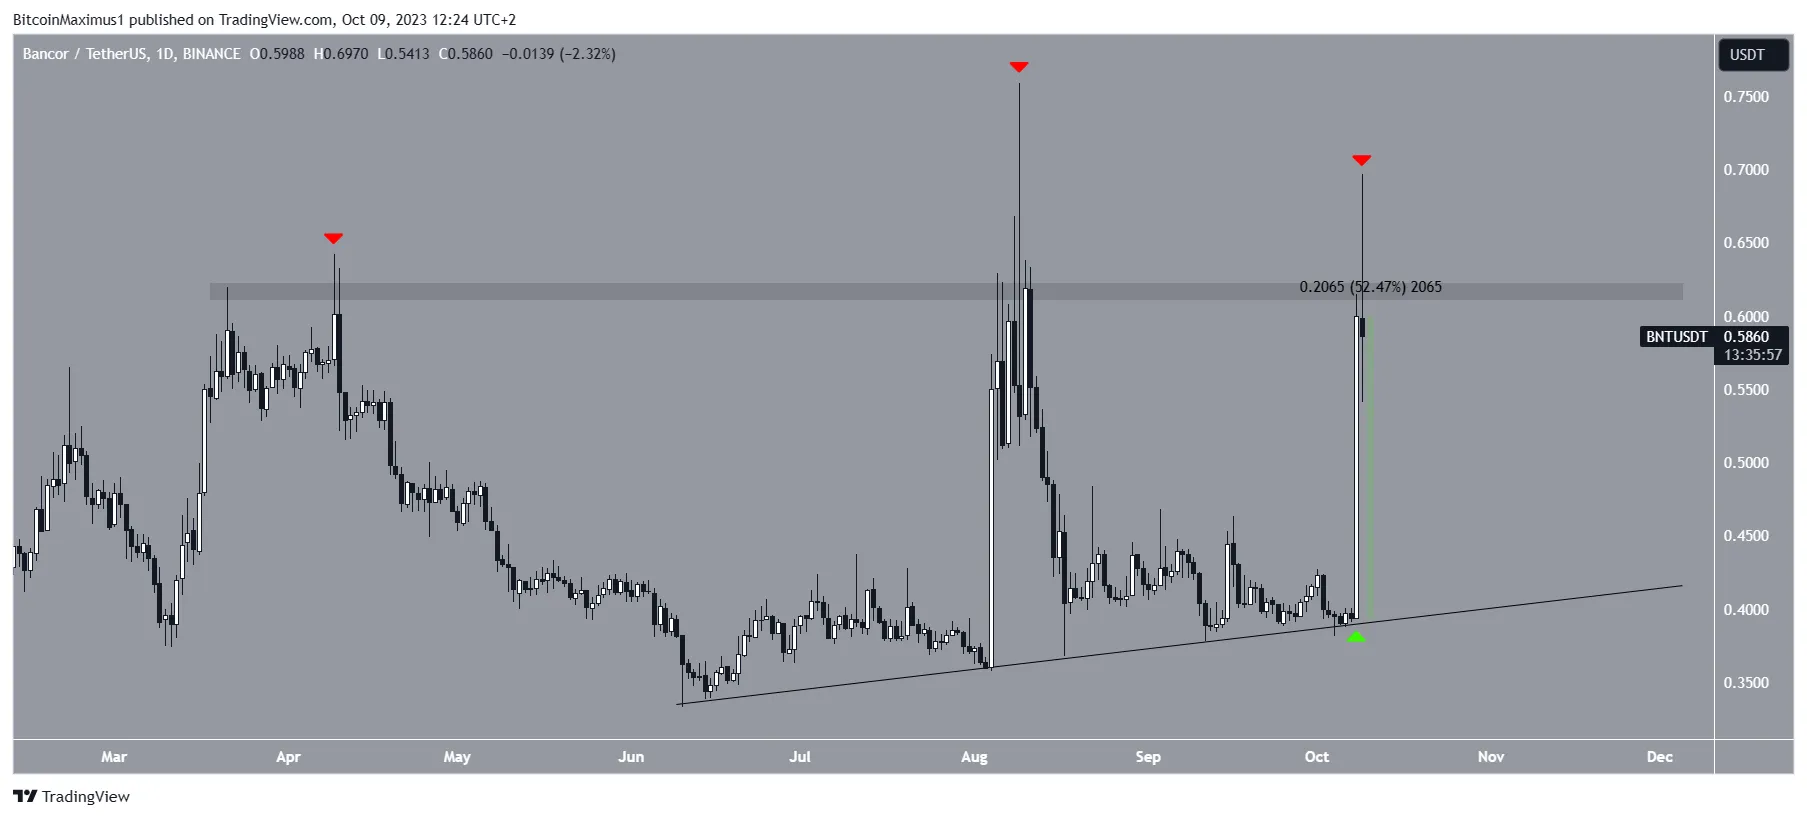
Technical analysis on the daily timeframe shows that the BNT price has consistently traded below the $0.62 horizontal resistance area since March 2023. Although the altcoin has moved above this area multiple times, it has failed to close above it, resulting in long upper wicks instead. These wicks indicate significant selling pressure and prevent the Bancor price from confirming a breakout above $0.62.
Since June, the Bancor price has also been following an ascending support line. On October 8, it experienced a 52% increase after bouncing off this line. However, the presence of long upper wicks during the upward movement limited the overall gain. Currently, BNT is trading below the $0.62 area once again.

The daily trading volume for Bancor has also significantly increased during the recent highs in August and October. On October 8, there were 797 active BNT addresses, the highest in nearly two years. Additionally, 157 new BNT addresses were created on the same day.
Furthermore, a wallet suspected to belong to the Upbit exchange has accumulated 4.71 million BNT tokens in the past 11 hours, which accounts for 3.3% of the total supply.
BNT Price Prediction: Is This Just the Beginning?
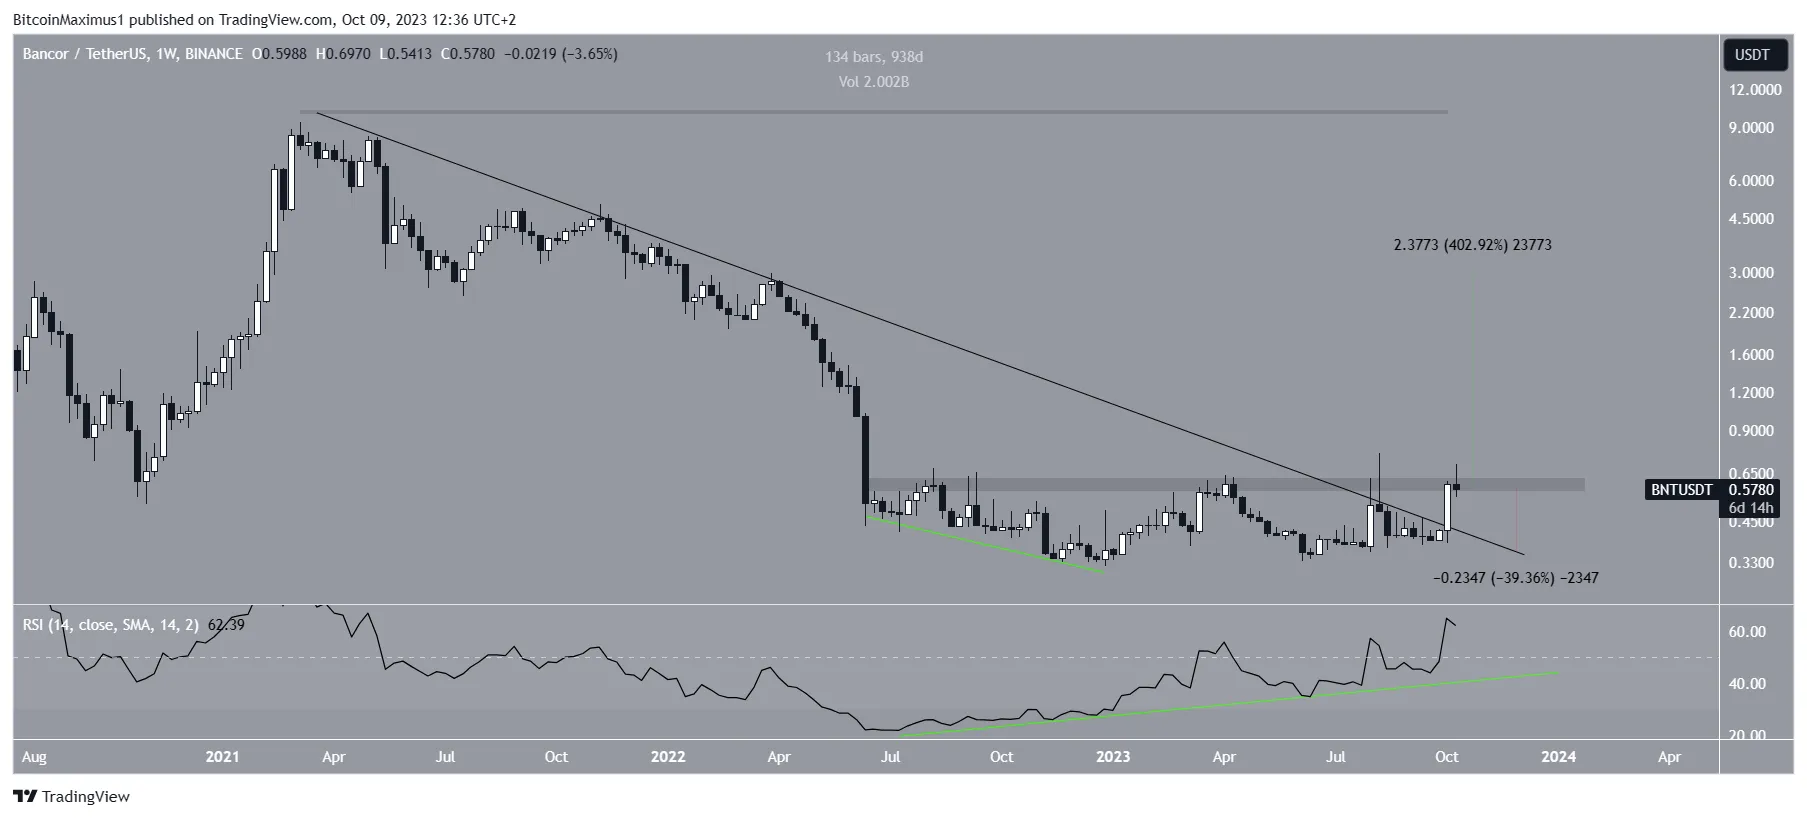
Based on weekly timeframe analysis, the recent increase in price could be the start of a long-term bullish trend reversal. This is primarily due to the breakout from a 940-day descending resistance trendline that occurred last week. Breakouts from such long-term trendlines often lead to significant price increases, and BNT is now within the $0.60 resistance area.
Another reason for a bullish outlook is the Relative Strength Index (RSI), which indicates momentum and overbought or oversold conditions. The RSI for BNT is currently above 50 and increasing, suggesting a bullish trend. Additionally, there was a bullish divergence between July and December 2022, where an increase in momentum followed a price decrease.
If BNT manages to break out above $0.62, it could potentially increase by 400% and reach the next resistance level at $3.20.

However, if BNT fails to close above the $0.62 area, it could experience a 40% drop to the descending resistance trendline at $0.40.
Hot Take: Bancor (BNT) Price Faces Resistance and Bullish Potential
The Bancor (BNT) price has encountered strong resistance at the $0.62 level, preventing it from sustaining its recent increase. Despite this setback, there are indications of potential bullish momentum for BNT. The breakout from a long-term descending resistance trendline and the presence of a bullish divergence on the RSI suggest that there may be more upside for BNT in the future. However, it is important to closely monitor whether BNT can break above the $0.62 level and maintain its upward trajectory. If successful, significant gains could be on the horizon for Bancor.


 By
By
 By
By
 By
By

 By
By