The Ripple XRP Price Drops Below Key Support Level
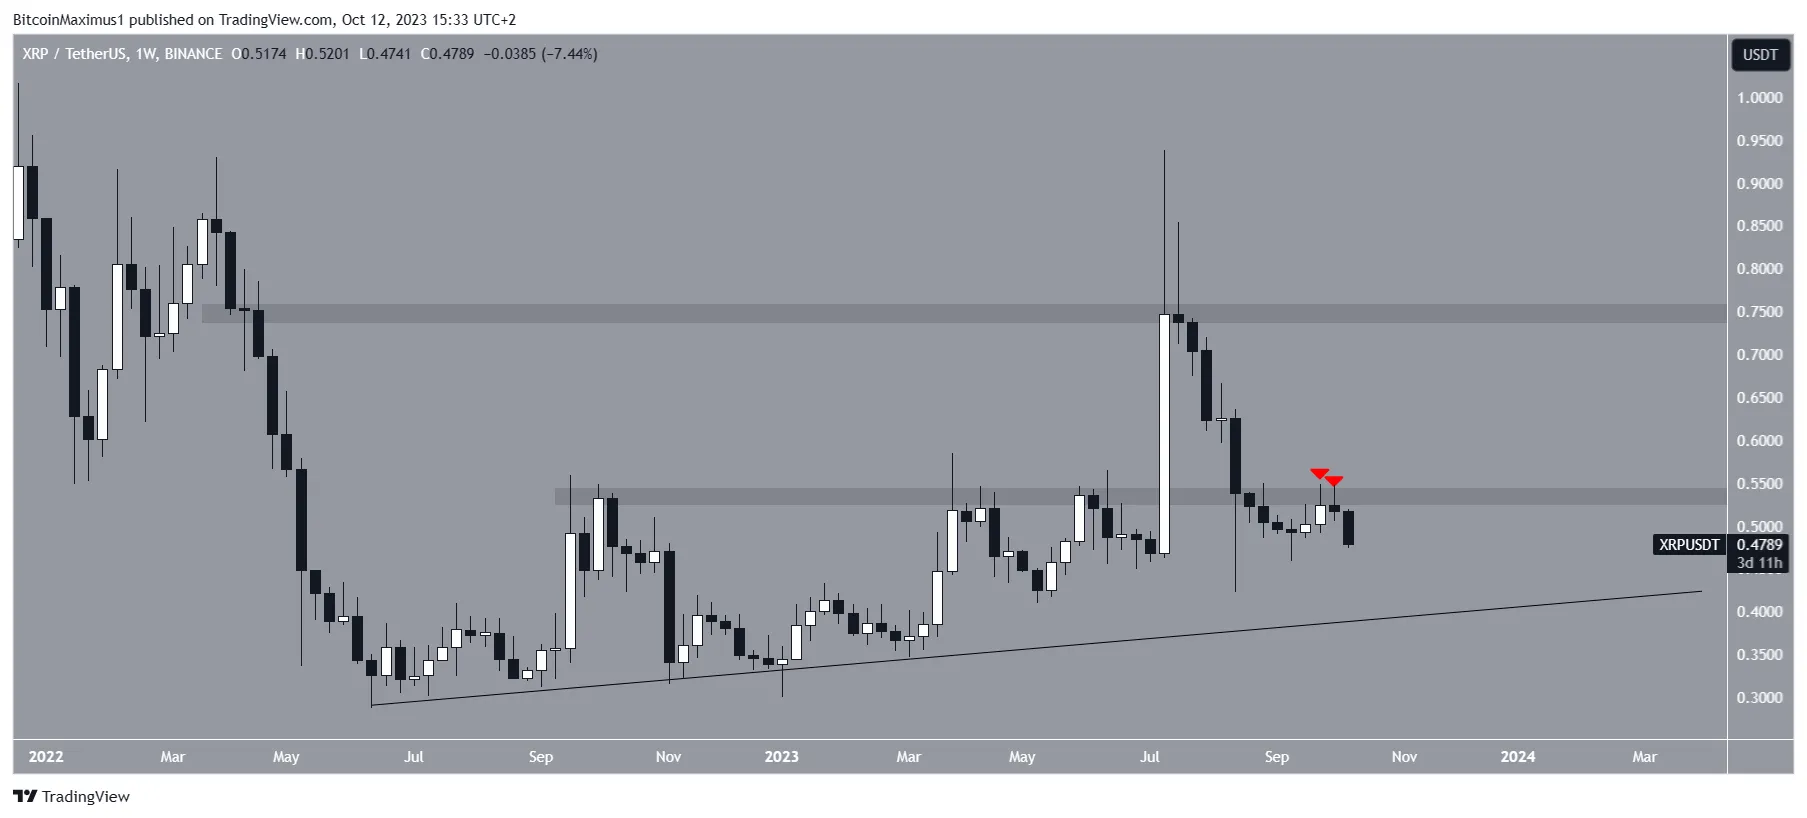
The price of Ripple’s XRP cryptocurrency recently fell below the important $0.53 support level. Despite temporarily halting its decline, Ripple made two unsuccessful attempts to reclaim the support level before continuing to fall this week. The question now is whether the XRP price can bounce back.
Ripple’s Support Breakdown
Analysis of the weekly time frame reveals that the XRP price has been declining since reaching its yearly high of $0.94 in July. This decline led to a low of $0.42, causing a breakdown below the $0.53 support level.
Although the price initially bounced back above $0.53, it failed to sustain the momentum and formed consecutive upper wicks. As a result, the decline resumed this week. Additionally, the XRP price has been following a long-term ascending support trendline since June 2022.

Negative News Impacting Ripple
This week, some negative news surrounding Ripple emerged. Binance announced that it will delist the XRP/BUSD pair due to low transactional activity in 2023. Additionally, Ripple Labs CFO Kristina Campbell announced her departure from the company.
However, not all news is negative as Judge Analisa Torres denied the Securities and Exchange Commission’s request to appeal a previous ruling. Furthermore, there is an upcoming policy summit scheduled between Ripple and Metaco on October 26.
Can XRP Price Reversal Occur?
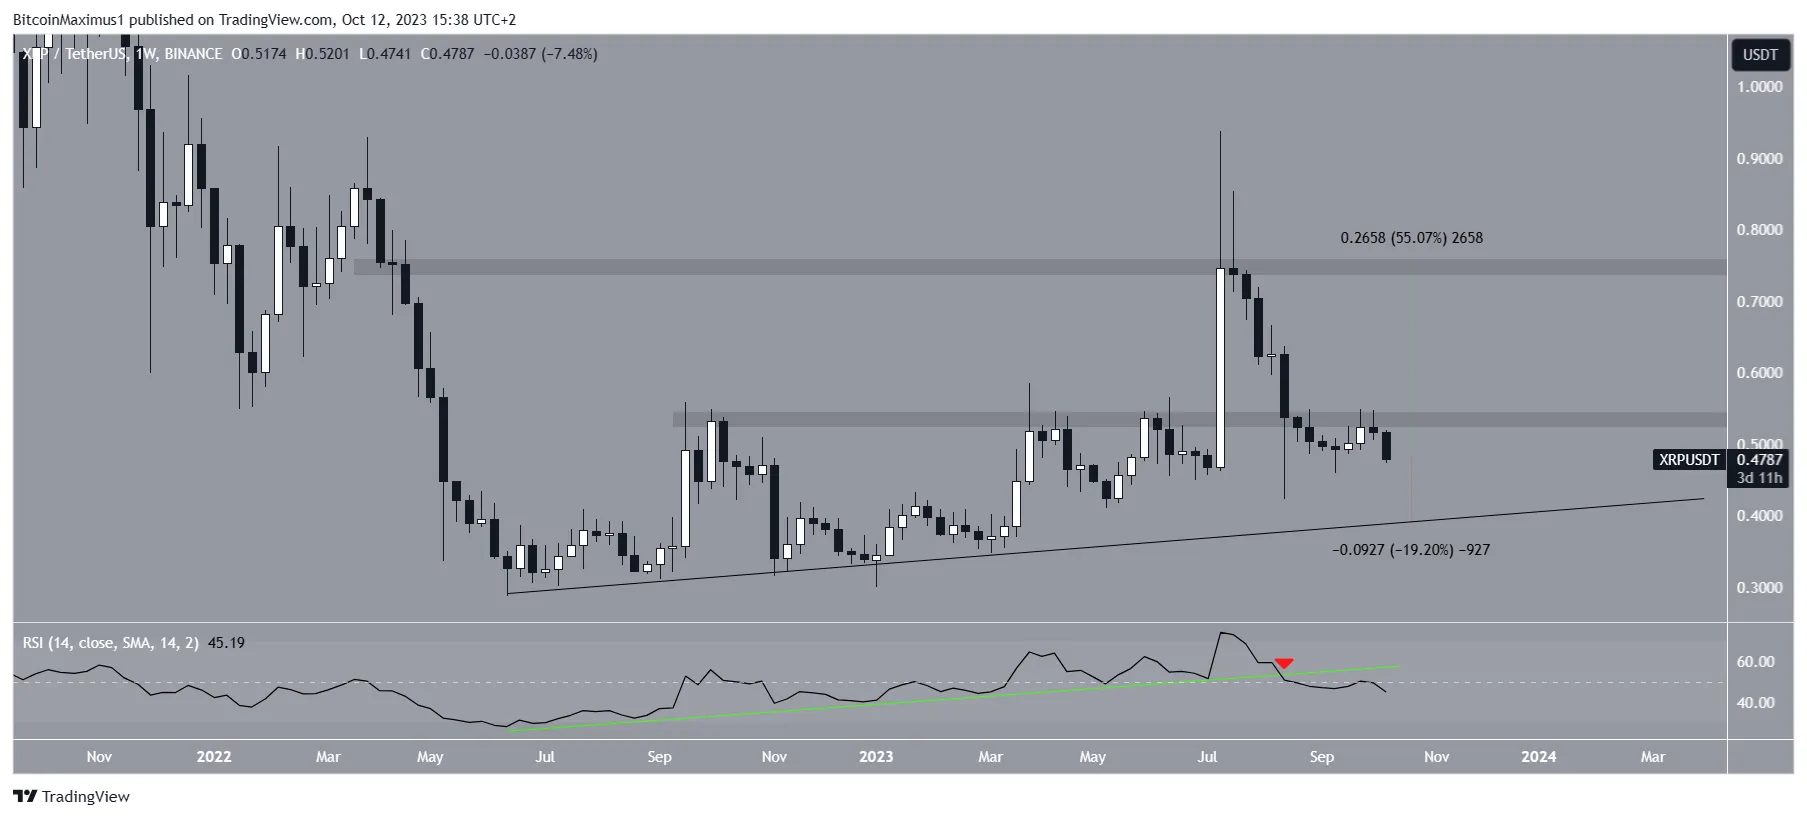
The weekly Relative Strength Index (RSI) indicates ongoing downward momentum. Traders use the RSI as a momentum indicator to determine if a market is overbought or oversold, and whether they should buy or sell an asset.
With the RSI currently below 50, which suggests a bearish trend, and having broken down from an ascending support trendline since July, the ongoing XRP price drop is supported by technical indicators.
It’s worth noting that over $15 million worth of XRP has been moved to a wallet in Bitstamp. If the downward movement continues, XRP could fall another 20% and reach its long-term ascending support line at $0.40.

Hot Take: Outlook for XRP Price
Despite the bearish prediction for XRP’s price, if it manages to close above $0.53 on a weekly basis, the trend may still be bullish. In that case, the price could potentially rise by 55% and reach the next resistance level at $0.75.


 By
By
 By
By
 By
By
 By
By
