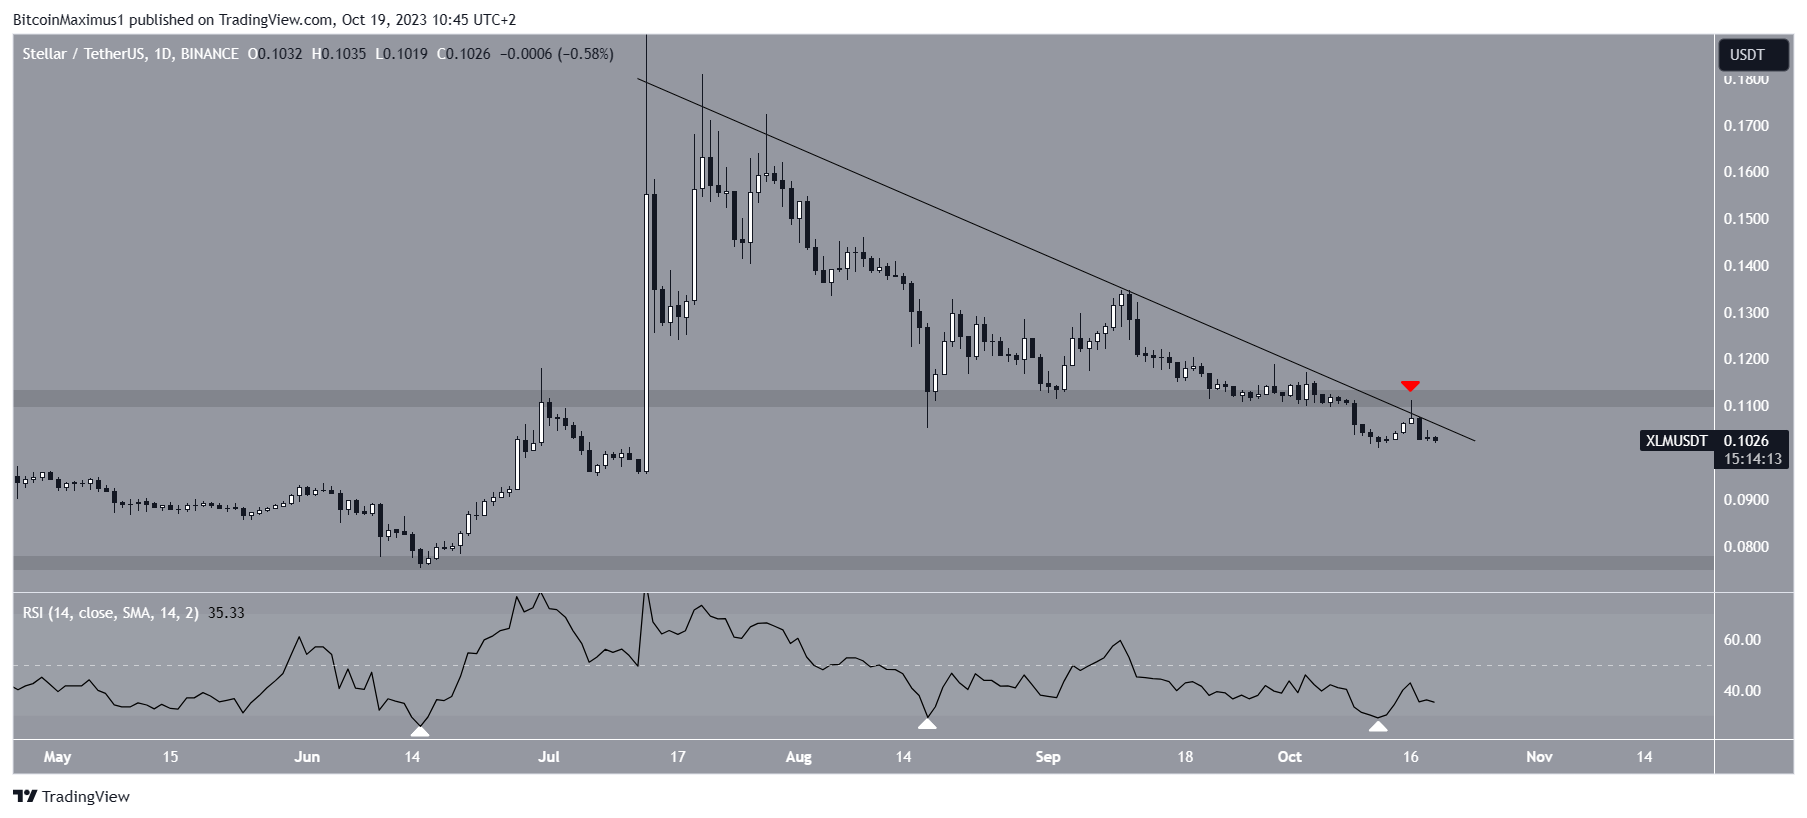
The Stellar (XLM) price has fallen below a long-term descending resistance trendline since July 13.
On October 9, XLM broke down from the $0.110 horizontal support area and was unable to reclaim it. The question now is how long this price rejection will continue.
Stellar Fails to Reclaim Long-Term Support
Looking at the daily time frame technical analysis for XLM, the price has been decreasing under a descending resistance trendline since July 12, after reaching its yearly high of $0.197. The breakdown below the $0.110 area, combined with the long-term descending trendline, formed a descending triangle pattern, which is considered bearish.
The Stellar price attempted to reclaim the resistance trendline and the $0.110 area but was rejected on October 16. This rejection triggered the current decrease.

The daily Relative Strength Index (RSI) indicates a bearish trend. Traders use this momentum indicator to assess whether a market is overbought or oversold, helping them make decisions on buying or selling assets.
A reading above 50 suggests a bullish trend, while a reading below 50 indicates the opposite. Since the RSI for XLM is currently below 50 and declining, it suggests a bearish trend for the price.
However, it’s important to note that the RSI reached oversold territory on October 15, and in the past, this has been followed by significant increases.
XLM Price Prediction: How Long Will Fall Continue?
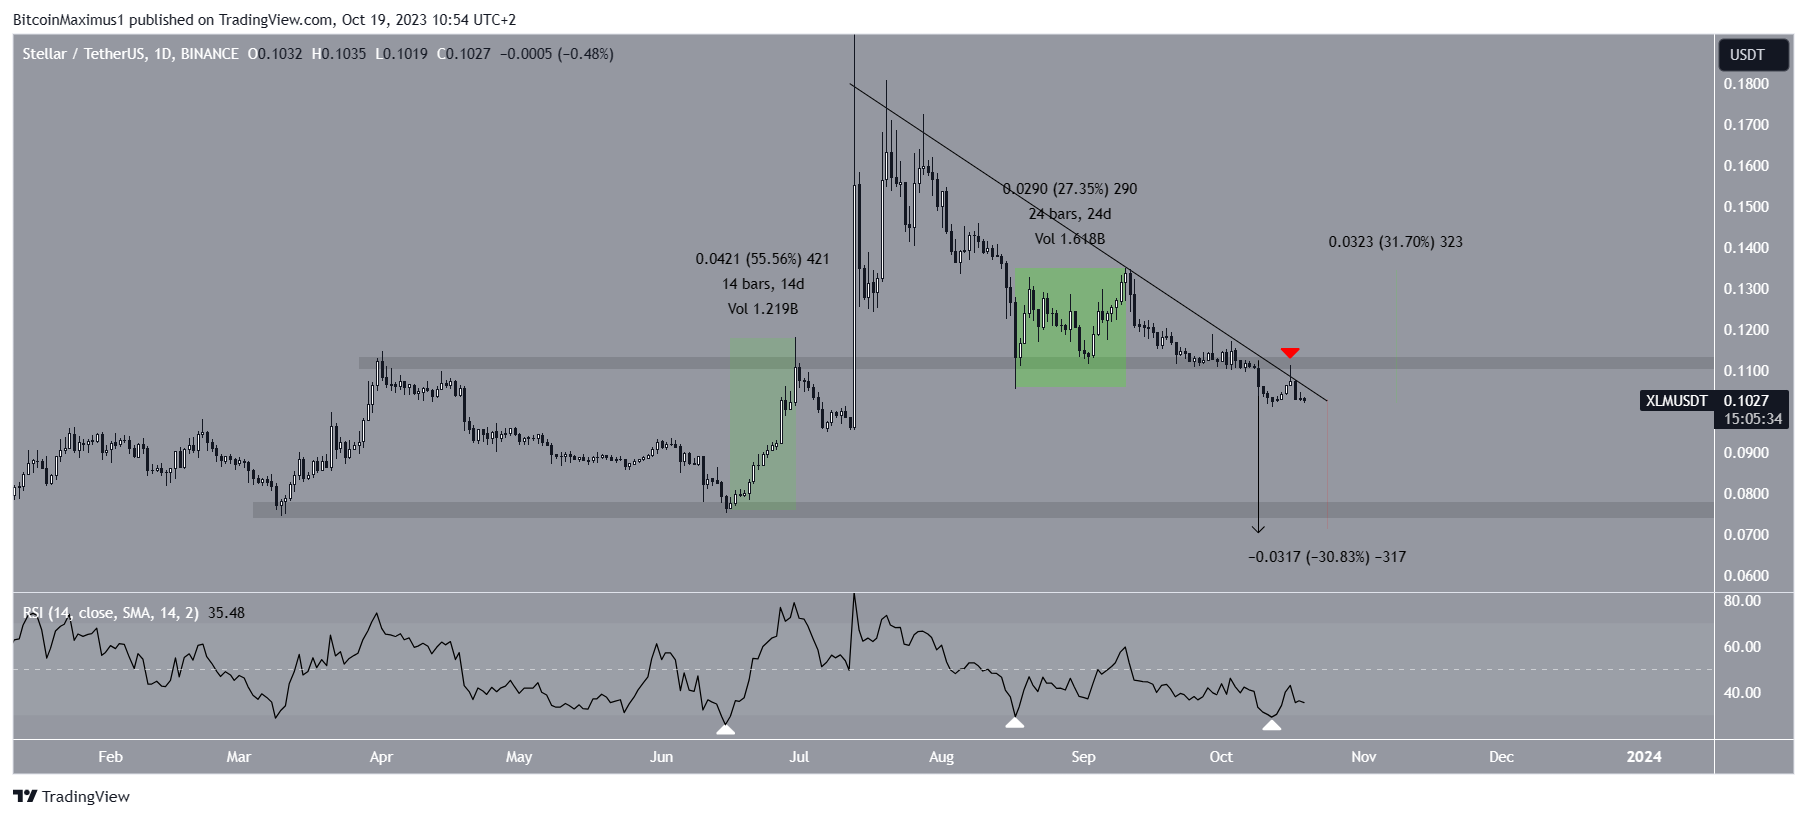
Considering the bearish RSI and the failed attempt to reclaim, it is likely that the XLM price will continue to decrease. If it follows the entire pattern’s height, it could drop slightly below the $0.076 horizontal support area, which has been in place since March. This would result in a 30% decrease from the current price.

Despite this bearish prediction, the oversold RSI could potentially lead to an increase. For this to happen, XLM needs to break out from the trendline and surpass the $0.110 resistance area. If successful, there could be a 30% increase to $0.140, similar to previous upward movements caused by an oversold RSI.
Hot Take: Stellar (XLM) Price Faces Continued Rejection and Possible Decrease
The Stellar (XLM) price has been facing rejection as it failed to reclaim long-term support and break out from a descending resistance trendline. The bearish RSI further supports the idea of a continued decrease in price. However, there is a possibility of an increase if XLM manages to break the trendline and overcome the $0.110 resistance area. Traders should closely monitor these key levels to determine the future direction of the XLM price.


 By
By

 By
By

 By
By