NEO Price Breaks Long-Term Resistance
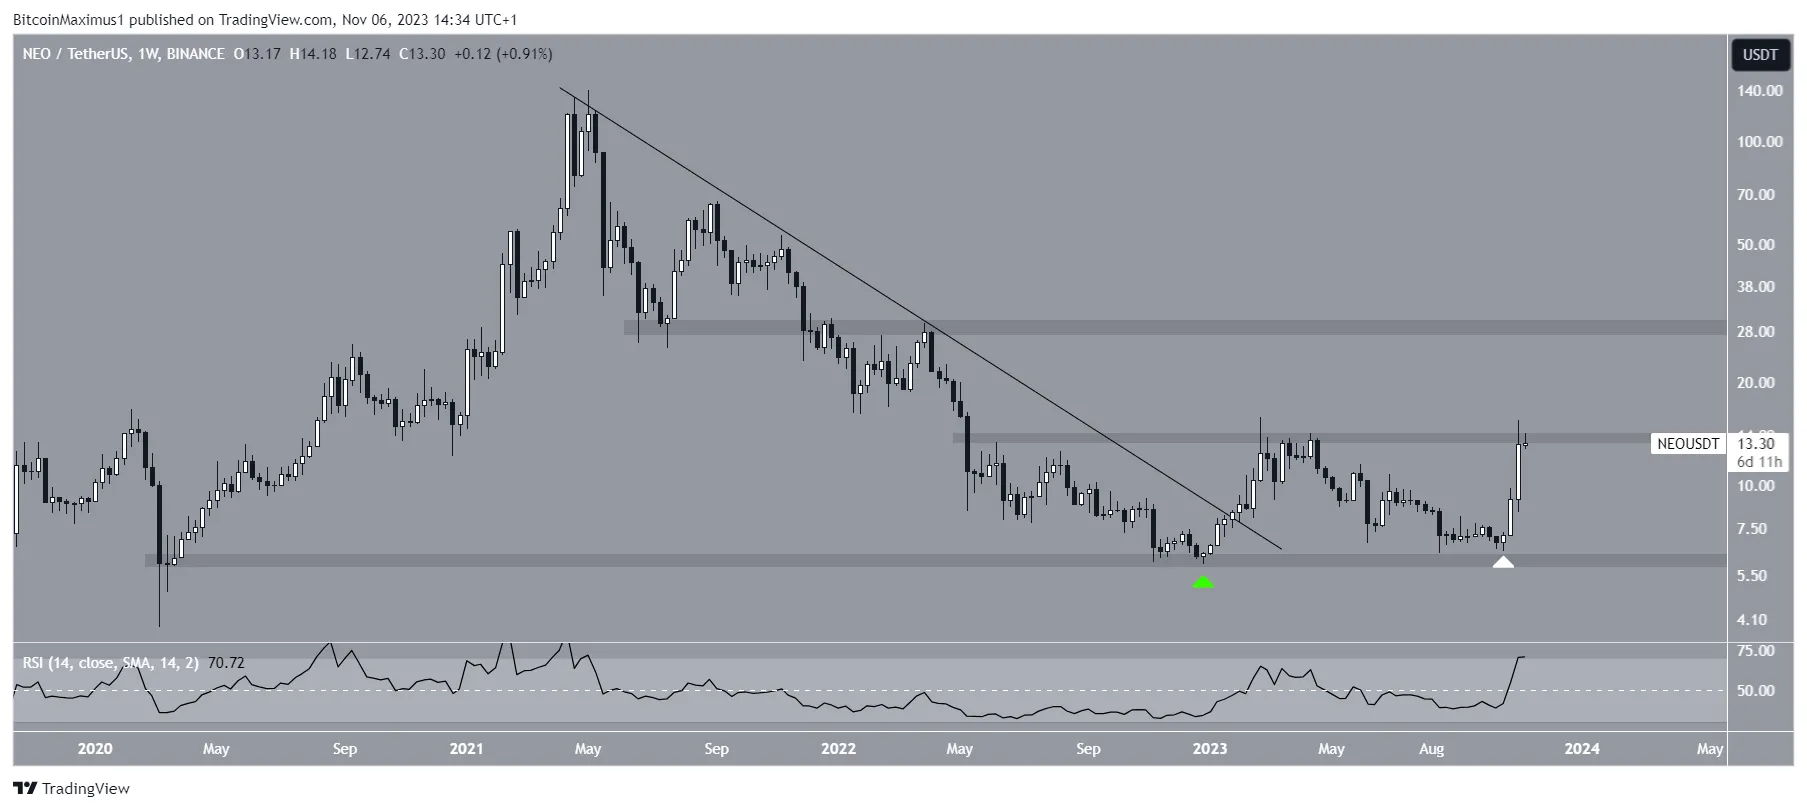
The NEO price has successfully broken out from a descending resistance trendline, both in the long-term and short-term. Currently, it is attempting to break through the $13.30 horizontal resistance area.
NEO’s Journey So Far
Since the beginning of the year, the NEO price has been on an upward trajectory after bouncing off the $6.10 horizontal support area. In January, it broke out from a descending resistance trendline.
Initially, NEO was rejected by the $13.30 area, but it created a higher low in October. Two weeks ago, the altcoin began another upward movement and is now making another attempt at breaking above the $13.30 resistance.
Bullish Signs for NEO
The weekly Relative Strength Index (RSI) for NEO is currently bullish. The RSI is a momentum indicator that helps traders determine if a market is overbought or oversold.
A reading above 50 with an upward trend indicates a bullish market, which is currently the case for NEO. The RSI is above 50 and increasing, signaling a positive trend for the altcoin.
Predicting NEO’s Future
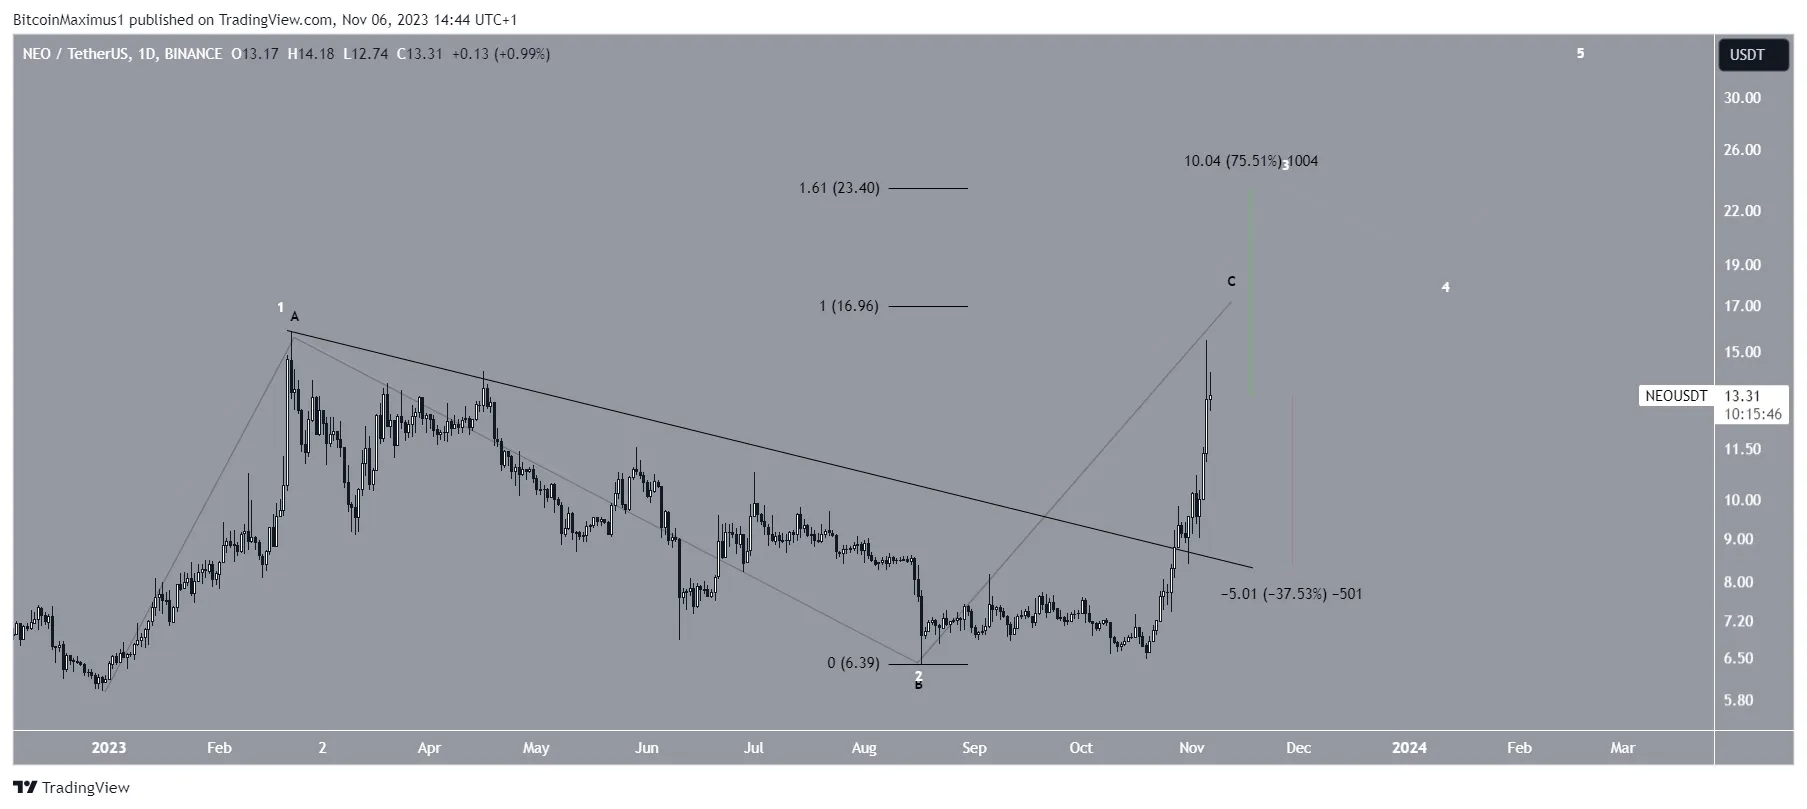
The daily timeframe technical analysis for NEO presents a mixed outlook based on the Elliott Wave count and RSI. The Elliott Wave theory is used by technical analysts to identify long-term price patterns and investor psychology.
There are two possibilities for NEO’s future count. If the increase is an A-B-C correction, the price will likely reach a local top near $17 before falling. However, if the increase is a new bullish impulse, the price could reach the $23.40 resistance area before a slight retracement and continuing its upward movement.
The Importance of $17 Resistance Area
The reaction to the $17 resistance area will be crucial in determining NEO’s future trend. A breakout above this level could lead to a 75% increase towards the next resistance at $23.40. On the other hand, a rejection could result in a 37.50% drop towards the descending resistance trendline.
Hot Take: Potential for NEO’s Continued Growth
As NEO breaks out from long-term resistance and shows bullish signs, there is potential for its growth to continue. Traders should closely monitor key resistance levels, such as $17 and $23.40, to gauge the altcoin’s future direction.





 By
By
 By
By
 By
By
 By
By
 By
By