The Shiba Inu (SHIB) Price Approaches Long-Term Resistance
Shiba Inu’s price is almost at the resistance trend line of a long-term pattern after breaking out of a short-term corrective pattern. This could signal the beginning of a new bullish rally for SHIB.
Technical Analysis of SHIB’s Price Movement
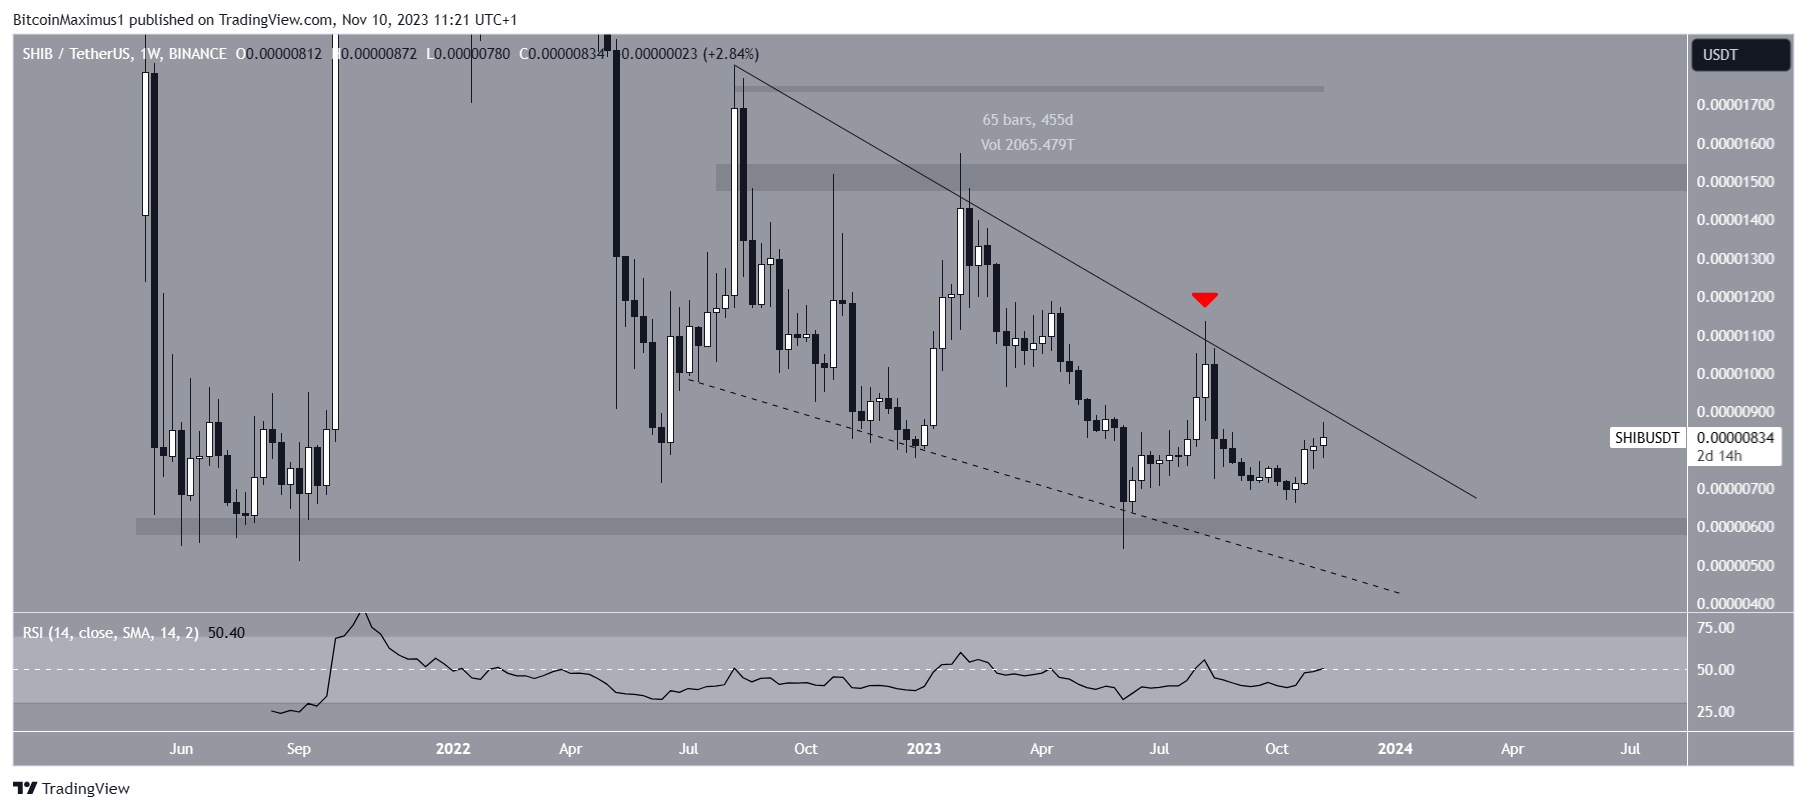
According to weekly technical analysis, the SHIB price has been under a descending resistance trend line since August 2022. The trend line previously rejected the SHIB price in August, resulting in a low of $0.0000066 in October.
There is also a possibility that SHIB is trading within a descending wedge, although the support line has not been validated enough times to confirm this pattern.
Uncertain Market Conditions for SHIB
The Relative Strength Index (RSI), an important momentum indicator, shows an uncertain reading for SHIB. While the RSI is rising, it remains below 50, indicating an undetermined trend for SHIB.

The Shiba team recently made a positive announcement about the release of the Shib Magazine.
Potential Reversal and Breakout for SHIB
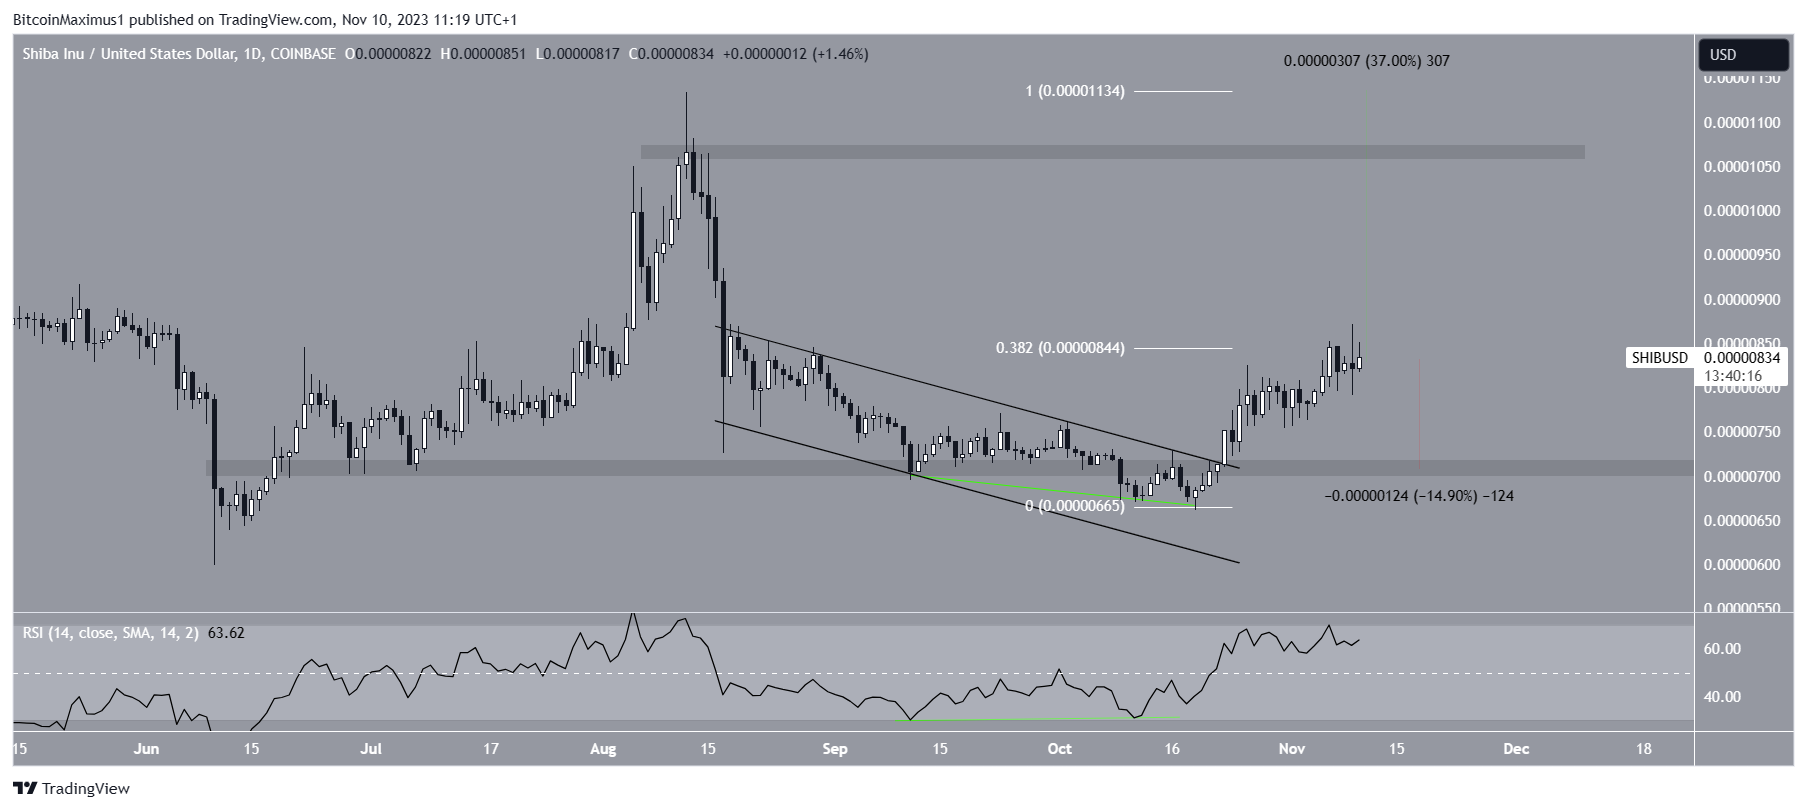
Daily timeframe analysis provides a more optimistic outlook for SHIB. The price broke out of a descending parallel channel on Oct. 22 and was accompanied by a bullish divergence in the RSI, indicating potential upward momentum.
If positive momentum continues, SHIB’s price may see a 37% increase and initiate a longer bullish trend reversal by reaching the next resistance level at $0.0000110.

Possible Outcomes for SHIB’s Price Movement
If SHIB fails to breach the 0.382 Fib retracement resistance level at $0.0000085, it could result in a 15% decline and confirm short-term horizontal support at $0.0000070.
Hot Take: Potential Upside for SHIB’s Price Movement
The technical analysis and market conditions suggest that there is potential for upside movement in SHIB’s price. However, it remains to be seen whether the breakout will lead to a sustained bullish trend reversal or if it will face resistance at key levels.


 By
By
 By
By
 By
By
 By
By
 By
By