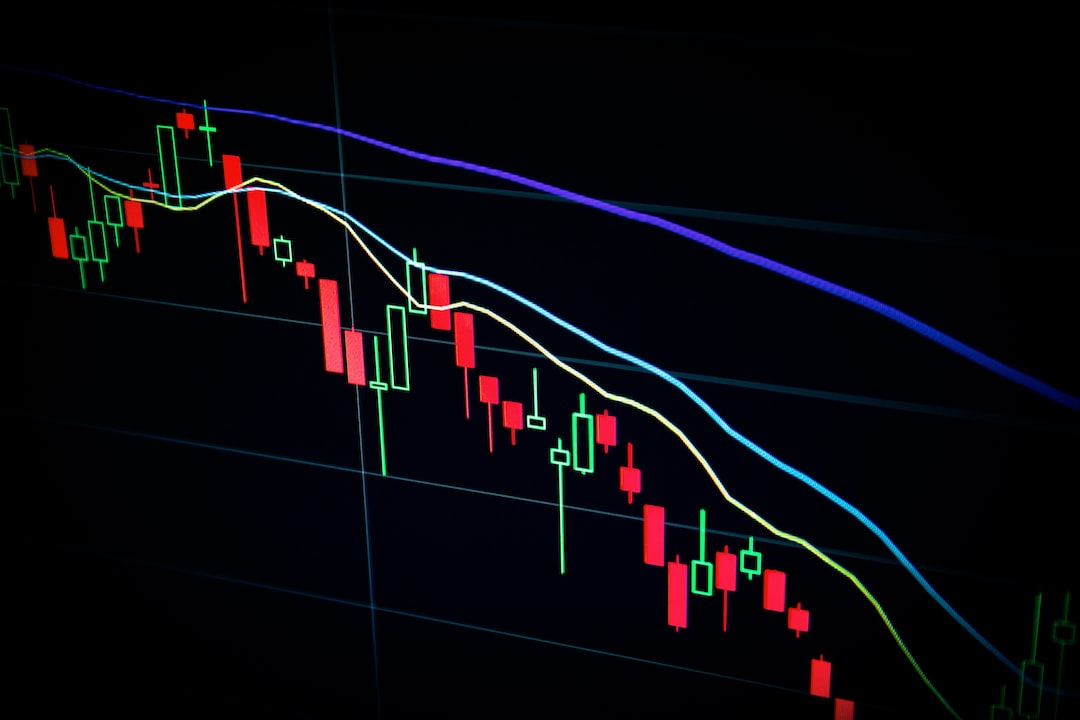
DOGE Struggles to Break Resistance
Dogecoin (DOGE) has faced difficulties in surpassing the $0.0920 resistance level. As a result, the price has experienced a fresh decline, following the trend of Bitcoin and Ethereum.
The cryptocurrency was unable to break above the $0.095 resistance zone and subsequently dropped below support levels at $0.090 and $0.0865. It even tested the $0.0760 area before starting a potential recovery wave. DOGE managed to move past the $0.080 resistance zone, clearing the 23.6% Fibonacci retracement level.
However, the price is currently trading below the $0.090 level and the 100 simple moving average (4 hours). On the 4-hour chart of DOGE/USD, there is a significant bearish trend line forming with resistance near $0.0920.
The price is currently facing resistance near $0.0875, which is close to the 61.8% Fibonacci retracement level. The next major resistance lies at around $0.090.
A close above this resistance level could potentially push the price towards $0.092 and even $0.095, with further gains leading it to reach as high as $0.105.
Possible Downside Scenario
If DOGE fails to gain momentum above the $0.0875 level, it might experience another decline. The initial support on the downside can be found near $0.080, followed by a major support level at around $0.0760.
In case of a downside break below the $0.0760 support, further decline is expected, potentially reaching as low as $0.0710.
Technical Indicators
The 4-hour Moving Average Convergence Divergence (MACD) for DOGE/USD is currently indicating bearish momentum. The Relative Strength Index (RSI) for the same time frame is below the 50 level.
Key Levels to Watch
Major support levels: $0.080, $0.0760, and $0.0710.
Major resistance levels: $0.0875, $0.0920, and $0.0950.
Hot Take: Dogecoin Faces Resistance in Price Recovery
Dogecoin continues to struggle in its attempt to break through resistance levels and initiate a recovery wave. Despite testing support levels, the price has been unable to gain significant momentum and remains below key resistance points. If the price manages to overcome these hurdles, it could potentially experience a bullish trend and reach higher levels. However, if the resistance proves too strong, a downside scenario may unfold, leading to further decline. Traders should closely monitor these key levels and technical indicators to make informed investment decisions.


 By
By
 By
By
 By
By
 By
By
 By
By
 By
By