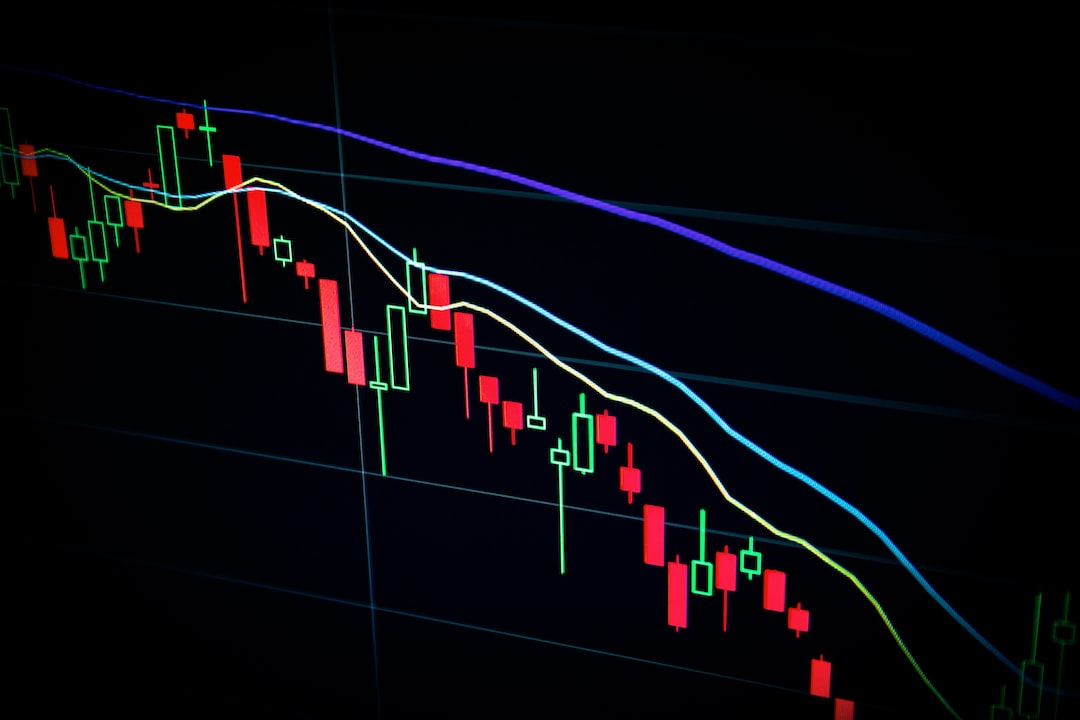
Dogecoin Price Nearing a Decisive Breakout
The correction in Dogecoin price, which is currently following a descending resistance trendline, indicates weakness in buyers’ conviction. However, a bullish breakout from the flag pattern would signify the end of the correction trendline. Additionally, the 24-hour trading volume in Dogecoin has seen a significant gain of 58%, reaching $2.58 billion.

When analyzing the daily timeframe chart, two key trendlines are evident in Dogecoin’s price movement. The first is a descending trendline that represents the current correction phase and provides dynamic resistance. The second is the neckline support of a Head and Shoulders pattern, which suggests an imminent trend reversal and a possible extended drop in value.
If market sentiment remains uncertain, Dogecoin may experience a bearish departure from these trendlines. This breakdown could amplify selling pressure and lead to a 24% drop in value, reaching a significant support level of around $0.058.
However, if the introduction of a Spot Bitcoin ETF has a positive influence on the broader altcoin market, including Dogecoin, there could be a breakout above the resistance trendline. This would invalidate the bearish scenario and potentially result in a 35% increase in Dogecoin’s value, reaching approximately $0.11.
Dogecoin- Global In/Out of the Money (GIOM)

The Global In/Out of the Money (GIOM) metric for Dogecoin paints a more positive picture. Currently, 55.68% of DOGE holders are “in the money,” while 38.81% are “out of the money.” This distribution suggests a relatively stable base of investors that could support a bullish trend in the future. However, if the Head and Shoulders pattern leads to a collapse, half of these addresses could be at a loss, increasing the likelihood of panic-selling.
- Relative Strength Index: The daily RSI slope below 50% indicates that sellers have a firm grip on Dogecoin.
- Exponential Moving Average: The coin price fluctuating between the 50-day and 200-day EMA reflects volatile market sentiment.
Related Article:
- Crypto Price Prediction For January 14: ETH, XTZ, SUI
- Which Top Altcoins To Buy January 15: HNT, XRP, LDO
- Bitcoin ETF Sparks Debate Between Legitimacy and Investment Purism
Hot Take: Dogecoin Price Prediction
The current downtrend in Dogecoin price can be traced using a descending resistance trendline. This decrease can be largely attributed to the widespread uncertainties surrounding the approval of a Bitcoin spot ETF. During this period, DOGE experienced a significant drop of 24%, declining from a high of $0.107 to a current price of $0.813. An examination of the Daily timeframe indicates that this decline has evolved into a pattern that could signal a potential further decline for DOGE.


 By
By
 By
By

 By
By

 By
By