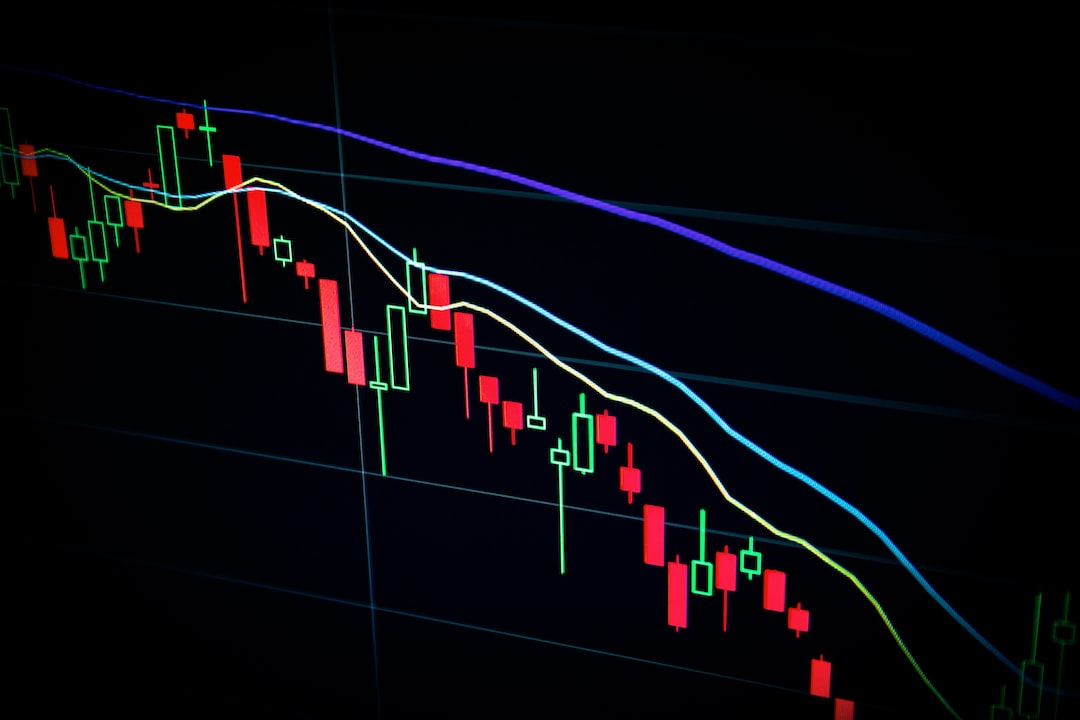
Why XRP Price Is Primed for a Bullish Reversal
The XRP price has recently experienced a correction phase along with the rest of the crypto market. However, this decline brings XRP close to its yearly support level, which could potentially spark buying interest and lead to a recovery.
The Importance of the Triangle Pattern
- The XRP price will remain in a sideways trend until the triangle pattern is intact.
- There may be increased demand pressure at the lower trendline of the triangle pattern.
- The intraday trading volume for XRP has decreased by 69%.
The XRP price has been on an upward trajectory since early 2023, supported by an ascending trendline. This trendline has acted as a strong support during market downturns, indicating bullish sentiment among buyers.
In fact, XRP has rebounded from this rising trendline three times in the past, demonstrating continued investor interest in acquiring the cryptocurrency during dips.
If selling pressure continues, XRP’s value may decrease further by approximately 2.5%, reaching the lower trendline at around $0.512.
If XRP manages to maintain its position above this support level in the coming days, it could see further upward movement within its current sideways trend.
To initiate a steady recovery, buyers need to overcome two key resistance trendlines depicted in the chart. Breaking above these trendlines would signal the end of the consolidation phase and the beginning of a new recovery phase for XRP.
Key Levels to Monitor
If XRP breaks above its overhead trendline, it could trigger increased buying activity and potentially drive prices to $0.70 and $0.75. On the other hand, if it breaks below the lower trendline, it may indicate a bearish shift with prices potentially dropping to $0.47 and $0.42 as sellers gain dominance.
- Exponential Moving Average: XRP is currently trading below both the 50 and 200-day EMA, suggesting a sideways to bearish market sentiment.
- Average Directional Index (ADX): The ADX slope at 29% indicates an aggressive bearish momentum, further confirming the prevailing downward trend.
Hot Take: XRP Price Poised for Recovery Amidst Market Correction
The recent correction in the crypto market has affected XRP’s price, but it also presents an opportunity for the cryptocurrency to bounce back. With its close proximity to the yearly support level and continued buyer interest during dips, there is potential for XRP to reverse its losses and aim for higher price levels. Traders should closely monitor key levels, such as the triangle pattern and resistance trendlines, to gauge the future direction of XRP’s price. Overall, despite the recent decline, XRP remains in a favorable position for a bullish reversal.


 By
By
 By
By
 By
By
 By
By
 By
By