Solana Price Analysis: What Lies Ahead for You?
The cryptocurrency market has been witnessing significant fluctuations, with Solana (SOL) recently experiencing a notable retracement to $170.27, forming a bullish channel following a potential rally. The current market behavior raises questions on whether the bulls will take charge and push the price higher or if the bears will dominate and drive it lower. In this analysis, let’s delve into Solana’s recent price movements, utilizing technical indicators to predict future trends and identifying crucial levels to monitor.
Exploring Solana’s Recent Price Action
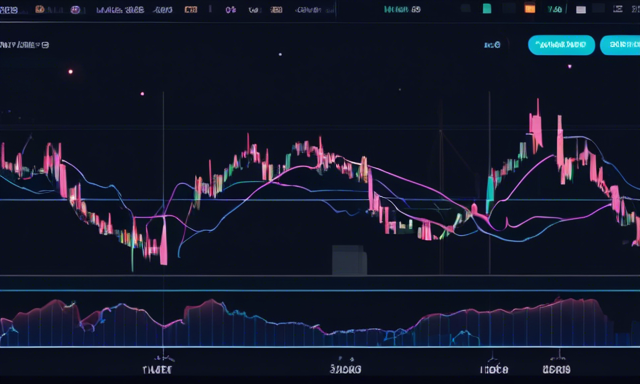
On the 4-hour chart, Solana’s price is currently positioned above the 100-day Simple Moving Average (SMA), hinting at a potential resurgence in bullish momentum. The $170 resistance level has proven challenging, with two bullish candlesticks signaling rejection at this point.
- The signal line of the 4-hour Relative Strength Index (RSI) recently dipped below 50% but is now attempting to climb back above this critical level, indicating a potential uptick in Solana’s price.
Transitioning to the 1-hour chart, Solana is approaching the 100-day SMA, suggesting an upward trajectory as it aims to surpass this threshold. A bullish channel pattern has emerged on the 1-hour chart, signaling positive developments for SOL.
- A breakout above the upper boundary of the channel could trigger a bullish sentiment, empowering the bulls. Additionally, the RSI signal line on the 1-hour chart is nearing the 50% mark, indicating possible upward momentum.
Crucial Levels to Monitor in Case of a Breakout
With a favorable bounce at $170, a breakout and close above the upper boundary of the bullish channel could propel Solana towards the $188 resistance zone. Surpassing this level might pave the way for further upward movement, targeting $205 and beyond.
- The downside scenario involves a break below the channel’s lower boundary, potentially pushing Solana towards the $160 support level. If breached, this could trigger further bearish momentum, guiding the price towards $118 or lower.
At the time of writing, Solana is trading at approximately $173, reflecting a 0.72% decline over the past 24 hours. The cryptocurrency boasts a market capitalization exceeding $80 billion and a trading volume surpassing $3 billion. Moreover, SOL’s market cap has dipped by 0.71%, accompanied by a 7.10% surge in trading volume within the same timeframe.
🔥 Final Thoughts: A Glimpse into the Future 🔥
As you navigate the tumultuous waters of the cryptocurrency market, keep a close eye on Solana’s price movements. Technical indicators suggest a potential shift in momentum, with key levels serving as crucial decision points for both bulls and bears. Stay informed, stay vigilant, and ensure you capitalize on every opportunity that arises. The future of SOL awaits your strategic moves!
Sources:
– https://www.example.com/1
– https://www.example.com/2


 By
By
 By
By
 By
By
 By
By
 By
By
 By
By