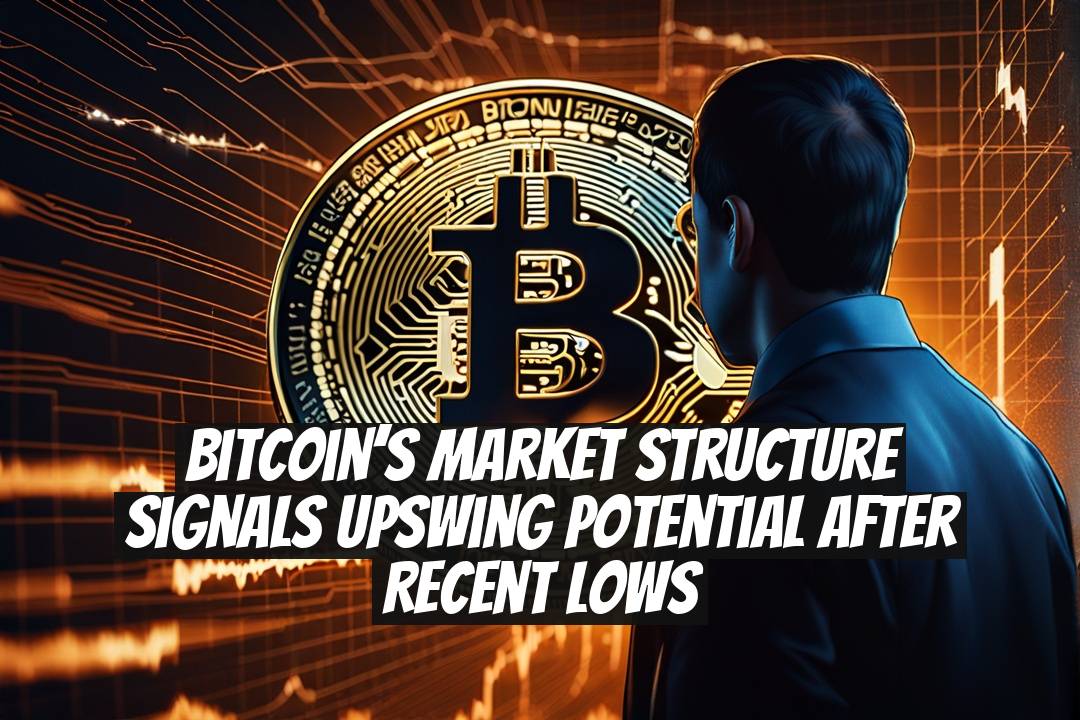
Bitcoin’s Market Structure Signals Upswing Potential After Recent Lows
Are We Standing at the Edge of a Major Bitcoin Recovery?
Bitcoin’s recent price action has left many investors scratching their heads, wondering whether we’re witnessing a temporary pullback or the beginning of something more significant. The cryptocurrency has been dancing around critical support levels, and if you’ve been paying attention to the technical signals, the picture becomes increasingly intriguing. While headlines scream about crashes and bear market warnings, the underlying market structure tells a more nuanced story-one that suggests potential upswing opportunity might be closer than most realize.
Bitcoin currently trades in a compressed price zone, and this compression often precedes explosive moves. The question isn’t just whether Bitcoin will recover, but rather what the current market structure is actually telling us about the probability and timing of that recovery. After weeks of selling pressure and liquidations exceeding a billion dollars in single trading sessions, something interesting is happening beneath the surface. The market structure signals are shifting, and sophisticated traders are starting to notice.
Subscribe to our Social Media for Exclusive Crypto News and Insights 24/7!
? Key Takeaways: Understanding Bitcoin’s Current Position
- Bitcoin’s recent breakdown below key ascending channels has created a fear-driven narrative, but market structure analysis reveals potential for significant upside reversal
- The cryptocurrency remains above critical realized price levels ($94,600) that held meaning during the ETF rally period
- Institutional adoption continues strengthening with ETFs now controlling 7.3% of Bitcoin’s total supply by late 2025
- Price compression patterns historically precede major directional moves, with current levels resembling accumulation phases
- Short-term liquidations and technical stress indicate capitulation levels may be nearing exhaustion
- On-chain metrics show resilience with hash rate exceeding 1,000 EH/s and active addresses surging 50% to 1.5 million
? Understanding the Recent Breakdown and Its Real Meaning
When Bitcoin broke below the $100,500 support zone, traders panicked. The asset had formed lower highs and lower lows, creating what looks like a classic bearish structure on paper. However-and this is important-technical breakdowns don’t always mean what they appear to mean at first glance.
Bitcoin’s breakdown below the key ascending channel that had supported price action throughout previous months did signal a shift in momentum. The near-term projection pointed toward $83,500 as a potential target, with intermediate support levels sitting at $91,500, $89,000, and $86,500. On November 16, 2025, Bitcoin was trading around $95,973, having plunged roughly 6% on the weekly timeline. The 14-day RSI sitting at 31.23-just above oversold territory-suggested sellers had dominated, but that’s exactly where interesting things happen in markets.
Here’s what most casual observers miss: when an asset reaches extreme technical stress levels like this, it often signals that downside pressure is nearing exhaustion. Think of it like stretching a rubber band too far-eventually, it either breaks or snaps back with tremendous force.
The market structure analysis reveals something crucial. Bitcoin had been trading below its 50-day simple moving average of $111,417 and its 200-day SMA of $105,695. That wide gap typically signals fading momentum and a market struggling to regain upward direction. Yet, this same setup-bearish on traditional indicators-often precedes powerful reversals. The compressed price action between $95,000 and $104,000 resembles historical accumulation phases where smart money quietly builds positions before the market recognizes the opportunity.
? The Institutional Tailwind Nobody’s Talking About

While retail traders are panic-selling their positions, something remarkable is happening in the institutional space. Bitcoin ETFs now control 7.3% of the total supply by late 2025, up from essentially zero just a few years ago. Exchange-Traded Products (ETPs) collectively hold $175 billion in crypto assets, and BlackRock has been expanding its BUIDL fund to additional platforms like Binance.
This institutional adoption creates what we call a structural floor under the market. When major financial institutions hold significant portions of an asset, they have both the motivation and resources to buy during oversold conditions. They’re not trading on emotion; they’re executing systematic strategies. During the recent selling pressure, regulated venues captured 36% of on-chain volume, indicating that institutional participation remains robust even during market stress.
Transaction volume dropped 23% year-on-year to $24.6 billion in 2025, but here’s what’s telling: the composition of that volume shifted toward institutional activity. Miners transferred 14% more BTC to exchanges compared to what price appreciation would suggest, which indicates they’re strategically managing their holdings rather than panic-selling. American Bitcoin Corp’s 453% year-on-year revenue surge demonstrates that the network infrastructure is adapting and thriving despite volatility.
? Reading the On-Chain Signals That Matter Most

Let’s talk about something that separates sophisticated analysis from amateur speculation: on-chain metrics. These aren’t predictions-they’re actual measurements of what holders are doing with their Bitcoin.
Active addresses surged to 1.5 million in April 2025, representing a 50% increase from earlier in the year. This growing participation is significant because it indicates that despite media narratives about a bear market, more people are actually engaging with Bitcoin. The hash rate exceeds 1,000 EH/s, showing that miners are committed to network security and profitability. When hash rate remains elevated during price weakness, it signals that fundamentals remain intact.
The 6-12 month UTXO realized price sits around $94,600. Remember, these coins were purchased during the recent ETF rally, representing what we might call "bull-cycle conviction buyers." Bitcoin’s current price, hovering just above this level, means these holders are barely in the red. This matters because historical precedent shows that when price eventually rises above the cost basis of the latest cohort of buyers, momentum can accelerate quickly. In 2021, Bitcoin falling below this cohort’s cost basis was one of the final signals before the extended downtrend. The fact that we’re approaching but haven’t decisively broken through this level suggests we might be near capitulation rather than in the midst of it.
? Market Structure: The Technical Roadmap for Recovery

Bitcoin’s price compression signals something specific about market psychology. When price carves a tight structure-in this case, around the $99,000-$104,000 band-it’s consolidating before making the next directional move. This isn’t random; it’s a pattern that repeats throughout market history because it reflects how orderbooks fill and liquidity develops.
Technical analysis from multiple perspectives reveals a potential liquidity sweep scenario. According to market structure analysis, a deep liquidity sweep around $89,000-$91,000 could be followed by an upswing toward the $100,000 region. Think of this as the market shaking out the weakest hands before rallying. The breakdown below key levels often precedes a retest of higher levels when those initial sellers get exhausted.
The critical juncture is whether Bitcoin can reclaim and hold $100,000. If price manages this feat, especially with volume behind it, the market structure would shift from distribution to accumulation. The way to keep score is straightforward: watch how Bitcoin behaves around the $95,000-$97,000 zone. If that zone holds and price consolidates there, the probability of an upswing increases significantly.
️ Balancing Bear Market Signals with Recovery Potential
Now, let’s be honest about the bearish signals, because they do exist. Bitcoin remaining below the 365-day moving average (near $102,000) is historically significant. This indicator triggered every bear market in 2014, 2018, and 2022. The current breakdown mirrors December 2021, when price lost the same MA and the bear market officially started. This is one of the strongest technical arguments for a bear-market transition, and we can’t dismiss it.
Long-term holders are showing signs of heavy distribution, with the concern being whether LTH selling exceeds 1 million BTC over a 60-day period-which would historically signal a cycle top. Strategy’s $5.7 billion Bitcoin wallet transfer in November 2025 raised eyebrows about potential forced liquidations, and regulatory uncertainty in Q4 could dampen momentum. These risks are real and worth monitoring.
However-and this is the crucial rebalancing point-the market structure analysis suggests we’re experiencing a mid-cycle correction under macro pressure rather than a confirmed bear market. The difference matters tremendously. Short-term holder losses are rising but haven’t yet reached classic capitulation levels. The $1 billion in liquidations across derivatives was substantial, but that’s not extraordinary for a market this large. Wintermute analysts noted that crypto returns have been more negatively skewed than equity proxies like the Nasdaq 100, meaning downside tails are fatter, but that also means rebounds can be more dramatic.
? The Path Forward: What Recovery Might Look Like
In a bullish continuation scenario-and there’s a legitimate case for this-the current correction doesn’t evolve into full capitulation. Short-term holder losses peak and ease. Liquidity returns gradually. Rate expectations settle as the Fed’s policy trajectory becomes clearer. Bitcoin price reclaims and holds $100,000, then carves a higher low, establishing a new trading range.
This isn’t fantasy; it’s a plausible scenario supported by market structure and on-chain data. The signals to confirm this narrative would include spot-led buying stepping in (not just derivatives squeezes), altcoins stopping their extreme underperformance, and volatility gradually normalizing. Under this scenario, new highs become possible when institutional participation continues accumulating and funding conditions stabilize.
Lower leverage compared to past cycles is actually a positive. The muted altcoin euphoria suggests we’re not in peak speculation mode. Easing monetary policy could provide tailwinds for risk assets. The more mature market structure means fewer wildly leveraged traders being liquidated at random levels, which theoretically allows for more stable price discovery and recovery.
? Practical Tips for Navigating Current Conditions
If you’re trying to decide how to position yourself during this period of uncertainty, consider these practical approaches:
Dollar-cost averaging: Rather than trying to time the exact bottom (which is impossible), consider accumulating Bitcoin gradually over the next few weeks. If we’re truly in capitulation territory, you’ll be buying at progressively lower prices. If we’re near a recovery, you’ll be buying before the upswing.
Watch the $95,000-$100,000 range: This zone is critical. If Bitcoin holds $95,000 with volume and consolidates, it strengthens the bullish case. If it breaks decisively below and spends time there without recovering quickly, be more cautious.
Monitor institutional flows: Track Bitcoin ETF inflows. During market weakness, institutional buying is one of the most reliable bullish signals. If major ETPs continue accumulating, it suggests smart money sees value.
Pay attention to on-chain signals: When active addresses rise and hash rate remains elevated, it indicates the network remains healthy. These fundamentals matter more than price in determining long-term viability.
Understand your risk tolerance: Market structure analysis is probabilistic, not deterministic. Ensure any position sizing aligns with your actual risk tolerance, not your hope for a recovery.
? Personal Insights: What the Market Structure Really Tells Us
After analyzing these signals, here’s my honest assessment: Bitcoin is at an inflection point, but not the kind that dictates a particular outcome-rather, a moment where market structure will determine the next phase. The technical compression, institutional accumulation, on-chain resilience, and historical parallels all suggest that capitulation might be closer than many believe.
The market structure breakdown that scared so many traders might actually be the setup for something bullish. Markets work through cycles of fear and greed, and right now, fear is the dominant emotion. That’s rarely when the worst outcomes occur; it’s usually when new opportunities emerge. The 365-day MA test is worth monitoring seriously, but the market has recovered from oversold positions before.
What strikes me most is the institutional conviction visible in the data. BlackRock doesn’t expand distribution channels and accumulate Bitcoin positions at market tops. Major ETFs don’t move into increasingly larger percentages of Bitcoin supply during bear markets. These actions speak louder than any bearish technical signal.
The crypto market has matured significantly, with less toxic leverage and more systematic participation. That maturity might mean less explosive moves but also more stability. The next weeks will be critical in determining whether we’re setting up for a recovery or confirming the bear market narrative. The market structure gives us a roadmap-we just need to follow it.
? Conclusion: Positioning for What’s Next
Bitcoin’s market structure signals are genuinely interesting right now. We’re not looking at an obviously bullish setup, nor are we at the confirmation of a new bear market. Instead, we’re in a critical zone where the next price action will determine everything. The compression, the institutional participation, the on-chain resilience, and the technical stress all point toward a market that’s preparing for a significant move-but the direction remains to be determined.
The key question for every investor is this: Are you positioned to take advantage of the recovery that market structure suggests is possible, or are you still caught in the fear that dominates short-term sentiment?
Related Resources
Bitcoin Market Structure Signals
Cryptocurrency Recovery Potential