On-Chain Pulse: Why Blockchains Aren’t Just Surviving-They’re Thriving
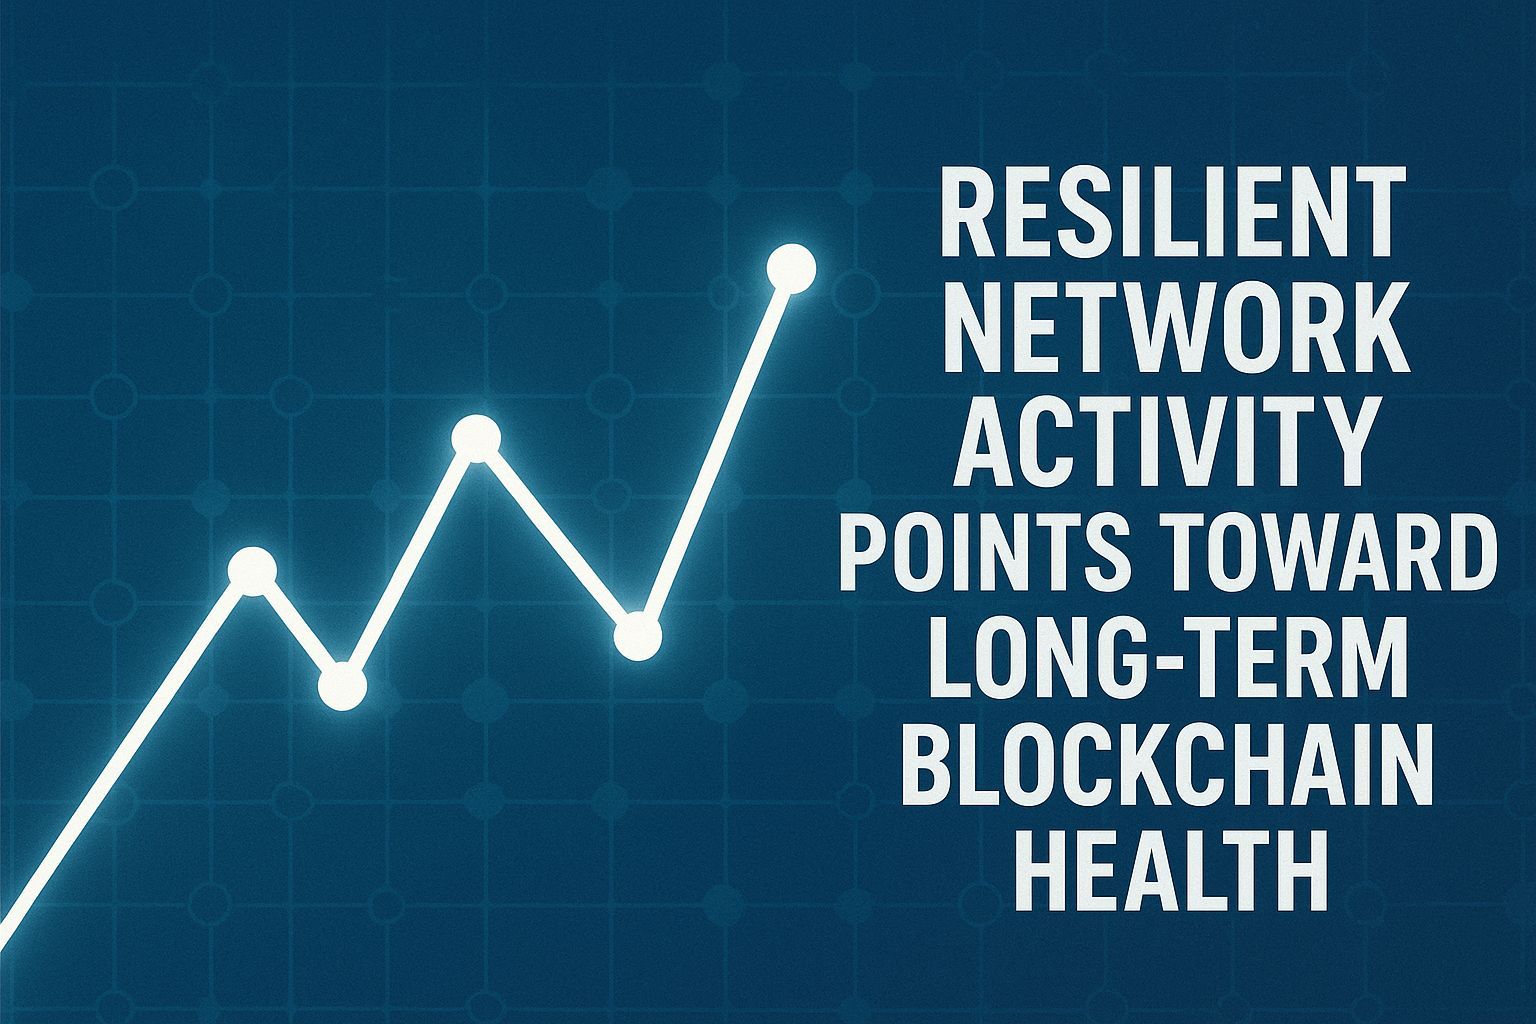
Resilient network activity points toward long-term blockchain health, even as prices swing wildly. Look at Ethereum hitting an all-time high of 2.23M daily transactions post-Fusaka upgrade, or Bitcoin bridges like tBTC locking up 5,942 BTC with 97% on Ethereum- that’s real usage, not hype.[3][4] You’ve seen the charts on Coin Metrics: active addresses nearing records, stablecoin transfers exploding.[3][5]
Key Takeaways: The Metrics That Don’t Lie
- Transaction highs don’t fake it: ETH mainnet smashed records at 2.23M daily txns; small stablecoin transfers under $1K tripled YoY to over 10M.[3][5]
- Developer grind pays off: GitHub commits, active repos, and new protocols signal innovation muscle-core to 2026 health checks.[1][8]
- Whale chill, retail rush: Big holders (1k-10k BTC) easing sells, while small fish scoop up dips-classic setup for momentum.[3]
- tBTC’s quiet flex: 48K BTC cumulative volume, no leverage drama, just steady Ethereum demand.[4]
Subscribe to our Social Media for Exclusive Crypto News and Insights 24/7!
Metrics That Actually Matter (Ditch the Noise)
Hey, if you’re knee-deep in crypto like me, you know total blockchain volume’s a liar-full of high-freq trading, arbitrage bots cycling funds like a bad loop.[2] TRM Labs nails it: it’s a “noisy denominator” masking real econ activity. Instead, zoom in on DApp adoption, user retention, and txn consistency.[1] Gate.io’s wiki spells it out: DAU and wallet adds are table stakes, but add governance participation and dev growth for the full health scan.[1]
Picture this: Chainspect’s dev dashboard shows active developers as the heartbeat-more commits, more repos, boom, ecosystem grows.[8] Combine with on-chain gems like unique active addresses and TVL growth. DeFi TVL dominates liquidity reads, cross-chain txns show network effects kicking in.[1] It’s not speculation; it’s utility stacking up.
ETH’s Record Sprint: Capital’s Actually Moving

Ethereum didn’t just tick up-it blasted to 2.23M daily txns, active addresses brushing ATHs, right as stablecoin volumes hit records in Dec.[3] Coin Metrics charts it clear: post-Fusaka, capital’s not parking; it’s zipping through DApps.[3] Stablecoin flows flipped positive into Jan after year-end wobbles-weekly net outflows over $1B reversed, signaling inflows resuming.[3] You’ve seen this before, right? Dips scare out weak hands, then real activity roars back.
Talos breaks it down: BTC to $94K, market cap ~$3.3T, spot ETFs pulling $400M inflows Jan 5th.[3] Retail (<1 BTC) piling in since Nov, whales cooling distribution. Constructive? Hell yeah-less sell pressure, steady demand.[3]
Bitcoin’s On-Chain Glow-Up via tBTC

Bitcoin’s not sitting idle. Threshold Network’s recap? tBTC TVL at 5,942 BTC Jan 19, 97% on Ethereum-consistent demand amid “market cycles.”[4] Cumulative 48K BTC volume, eyeing 50K by Q2. Alea Research’s tBTC Blueprint: 800% growth since ’24, trust-minimized, no shady rehypothecation.[4] It’s Bitcoin liquidity scaling onchain without selling your soul. Holders love it: predictable, secure, Ethereum-integrated.
Devs and DApps: The Unsung Heroes

Don’t sleep on devs, fam. Chainspect tracks active devs as ecosystem vitality #1.[8] Gate.io pushes GitHub activity, new protocol deploys-direct ties to long-term edge.[1] Coin Metrics adds: txn costs sub-cent now, unlocking micropayments, remittances.[5] Small stablecoin txns tripled; high-value settlements up too. That’s blockchain health: cheap, scalable, real-world ready.[1][5]
Whales ain’t sleeping-they’re bridging BTC via tBTC, rotating into ETH action.[4] Imagine holding through 2025’s illicit volume spike to $158B (TRM’s crime report), but on-chain utility kept climbing anyway.[2]
Stablecoins and Flows: Liquidity’s Real Test
Stablecoin flows proxy capital in/out. Turned positive Jan ’26 after $1B+ outflows-good omen if it sticks.[3] VASP outflows better gauge illicit risk than raw volume, says TRM-focus on deployable liquidity.[2] Composite indices weighting DeFi TVL, NFT txns, governance? Gold standard for health.[1]
BTC dominance hit 64% in ’25, ETFs hoarding 1.36M BTC (~6.8% supply).[5] Institutional creep via retirement funds? Incoming.[5]
- https://web3.gate.com/crypto-wiki/article/what-metrics-determine-crypto-community-and-ecosystem-activity-in-2026-20260112
- https://www.trmlabs.com/reports-and-whitepapers/2026-crypto-crime-report
- https://www.talos.com/insights/state-of-the-network-345
- https://threshold.network/blog/january-2026-recap-scaling-bitcoin-onchain-with-tbtc/
- https://coinmetrics.substack.com/p/state-of-the-network-issue-343
- https://coinmetrics.io/state-of-the-network/cryptos-constructive-start-to-2026/
- https://sarsonfunds.com/crypto-market-outlook-2026/
- https://chainspect.app/dashboard/developer-activity


