Bitcoin’s $65,300 Reality Check: When Geopolitical Shocks Meet Weak Hands
The Bounce That Wasn’t (Yet)
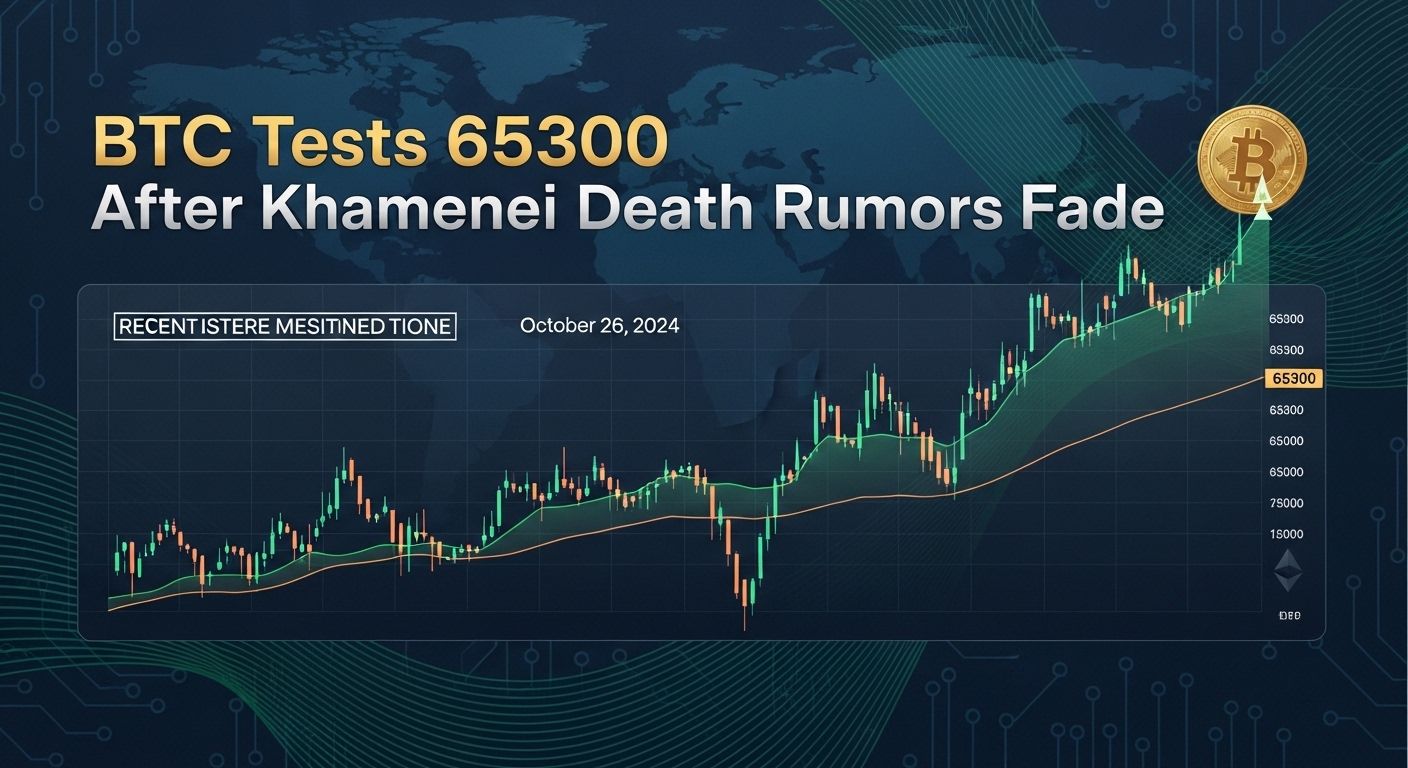
Bitcoin just went through one of those whiplash weekends that remind you why this market never sleeps. After Iranian Supreme Leader Ayatollah Ali Khamenei’s death sent shockwaves through global markets, BTC spiked to $68,196 on the rumor alone[2]. But here’s the thing-that rally evaporated faster than morning dew. By Sunday afternoon, Bitcoin had retreated to around $65,300, down 2.1% on the day[2][4]. The broader crypto market? It got hammered for $128 billion in total capitalization[4].
What made this weekend particularly brutal wasn’t just the geopolitical chaos-it was what happened underneath. Joint US-Israel military strikes on Iran sent shrapnel through investor confidence, and suddenly everyone wanted downside protection. We’re talking $1.9 billion in Bitcoin put options stacked at the $60,000 strike[2]. That’s not casual hedging. That’s institutional traders bracing for impact.
Subscribe to our Social Media for Exclusive Crypto News and Insights 24/7!
Key Takeaways
- Bitcoin tested support at $65,300 after failing to hold gains from Khamenei death rumors, exposing deeper structural weakness[2][4]
- ETF flows are the make-or-break signal when US markets reopen Monday-last week’s $1 billion inflow streak needs to hold or BTC could punch through to $63,000[2][4]
- Major on-chain supply clusters sit between $65,636 and $66,800, creating a dangerous compression zone where a breakdown could trigger a cascading move toward $56,000[1]
- Institutional investors are actually leaving, with spot Bitcoin ETFs recording five consecutive weeks of net outflows-that’s the opposite of what recoveries need[1]
The Institutional Exodus Nobody Wants to Talk About
Here’s what’s eating at smart money right now: spot Bitcoin ETFs have now posted five consecutive weeks of net outflows[1]. Let that sink in. While retail traders are getting excited about weekend bounces, institutions are quietly heading for the exits.
This is the antithesis of what a healthy recovery looks like. Normally, you’d want to see institutional capital stepping in at support levels. Instead, you’re watching large players reduce exposure right when the chart’s getting spicy. That reduces support during price declines-meaning the next leg down could be… well, fast[1].
The contrast is sharp: Last week, spot Bitcoin ETFs pulled in $1 billion over three consecutive sessions[2]. But will that momentum survive when Monday’s cash opens and traders actually have to decide what to do with their positions? That’s the real question[2][4].
Supply Clusters: The Invisible Ceiling

Bitcoin’s on-chain data is screaming something that price action hasn’t fully priced in yet. The largest supply cluster sits above $66,800-and it’s massive. We’re talking 3.17% of Bitcoin’s entire circulating supply concentrated in one zone[1]. That’s not noise. That’s friction.
Below that? Another major cluster at $65,636 holding an additional 1.38% of supply[1]. These aren’t random price levels. They’re where people got trapped, broke even, or decided to exit. They’re where buyers disappeared last time price moved up.
The mechanics are simple: When price approaches these zones, sellers emerge. Momentum fades. And if momentum fades hard enough, you get what technical analysts call a “head-and-shoulders breakdown”-in this case, with a neckline sitting near $60,800[1]. The math on that target? A 7.5% drop from current levels, pointing toward $56,000[1].
The $70,000 Question: What Needs to Happen
Here’s the fork in the road. Bitcoin needs to do one of two things, and both require something it currently lacks: conviction.
Upside recovery demands reclaiming $70,000, which would signal renewed institutional strength[1]. That’s not a casual bounce-that’s a statement. Right now, $68,200 is the bare minimum to stabilize short-term structure[1]. Below that level? The bearish structure remains in place. Simple as that.
The first support levels are $67,300, then $66,500, then $65,300[1]. You’re watching these melt down like ice in summer, and honestly, the fact that Bitcoin’s even at $65,300 after the weekend tells you the bid was there. But whether it stays there is a different animal entirely.
The Iran Wildcard: Contained or Cascading?
Let’s be real about what happened over the weekend. Bitcoin went haywire the moment the joint military operation broke. Prices initially noshed to around $63,000 before bouncing back[2]. Then came the Khamenei death rumors-the spike to $68,196-and then… silence. Reality reasserted itself.
Tokenize Capital, the investment fund tracking this move, nailed it: “The actual price will be determined on March 2nd when the US stock market and Bitcoin ETFs reopen”[4]. Translation: The weekend action was noise. Monday’s action is signal.
The real risk? Missiles hitting Dubai. The Strait of Hormuz closure threat. These aren’t abstract scenarios-they’re tail risks with concrete economic consequences[2]. One analyst noted that Bitcoin ETF flows will be “the single most important number to watch when trading resumes”[2]. If that $1 billion inflow streak flips negative, Bitcoin could “punch through below $63,000″[2].
But here’s the contrarian take buried in the data: Some observers reckon the crypto market will weather this[4]. Market research firm 10x Research noted that traders generally don’t expect the Iran conflict to have “overly negative economic consequences”[4]. They’re pointing to market expectations centered around $75,000 per Bitcoin, anchored to the upcoming Federal Reserve meeting[4].
That’s a wide spread-$56,000 on the downside, $75,000 on the upside. You’re looking at a market that’s genuinely unsure.
The Accumulation That Wasn’t
Glassnode’s Bitcoin Accumulation Trend Score tells a story that price action only hints at[5]. Back in November, when Bitcoin crashed hard, the metric showed near-perfect accumulation behavior-whales and smart money were loading up[5]. That’s what you want to see at bottoms.
But here’s where it gets messy. December kept that accumulation rolling. Then January happened. The price recovery rally met distribution-meaning large holders were selling into strength, not buying[5]. Since early February, the Accumulation Trend Score has “struggled to push above 0.5,” reflecting “persistently weak accumulation, particularly among larger entities”[5].
Translation: Meaningful capital hasn’t stepped back in. The price has been recovering on thin air-retail enthusiasm and short-covering, not institutional conviction[5]. That’s a precarious foundation when supply clusters are this dense and geopolitical risk is this elevated.
What Gold and Oil Did (And Bitcoin Didn’t)
While Bitcoin was busy failing its war stress-test, gold extended what’s now a seven-month consecutive winning streak-its longest in years[6]. Prices surged to the $5,293-$5,386 range[6]. Oil did its thing. Traditional risk-off assets proved their mettle.
Bitcoin? It swan-dived into support. The narrative of “crypto as a hedge” took some dents this weekend. That matters psychologically for the institutions still deciding whether to accumulate on dips.
The Repair Path vs. The Fade Path
Here’s how one analyst mapped the market’s three clean paths forward[3]:
The Repair Path: ETF inflows persist. Price holds above $65,000. The tape earns a conversation with $66,894 and $67,995. It’s slow, methodical, powered by patient spot bids and wrapper creations[3].
The Fade Path: Flows reverse. Skew stays deeply negative. Rallies meet the $65,000 to $67,000 supply wall and get rejected. Price drifts back toward the $61,000 hinge[3].
Right now, you’re at the junction. Monday morning’s ETF flow data will tell you which path the market’s choosing.
The Bottom Line
Bitcoin’s bounce to $65,300 after the Khamenei death rumors faded is a textbook case of what this market does: it chases headlines, then reality-checks itself. The geopolitical shock was real, but the underlying weakness was already there-five weeks of institutional outflows, massive supply clusters, weak accumulation behavior, and leverage risk that keeps building[1][5].
The next 48 hours will either confirm a local bottom (ETF flows turn positive, $65,000 holds, and we grind higher) or trigger the deeper correction everyone’s quietly worried about (flows flip, support breaks, and we’re headed for the low $60,000s)[2][4].
You’ve seen this before, right? BTC teasing breakout, then faking out. The difference this time is what’s happening behind the scenes-or rather, what’s not happening. The big money isn’t here yet. And without them, this bounce’s got an expiration date.
- https://beincrypto.com/bitcoin-price-flashes-major-crash-warning/
- https://www.heygotrade.com/en/news/iran-war-rattles-crypto-bitcoin-slides-to-65300/
- https://cryptoslate.com/if-bitcoin-can-hold-65000-after-its-strong-bounce-it-can-avoid-a-deeper-crypto-winter/
- https://www.vietnam.vn/en/bitcoin-lao-doc
- https://www.tradingview.com/news/newsbtc:34626c8bf094b:0-bitcoin-yet-to-see-meaningful-capital-return-glassnode-says/
- https://www.cryptotimes.io/2026/03/02/bitcoin-failed-war-test-gold-didnt-oil-crypto-asian-markets/


