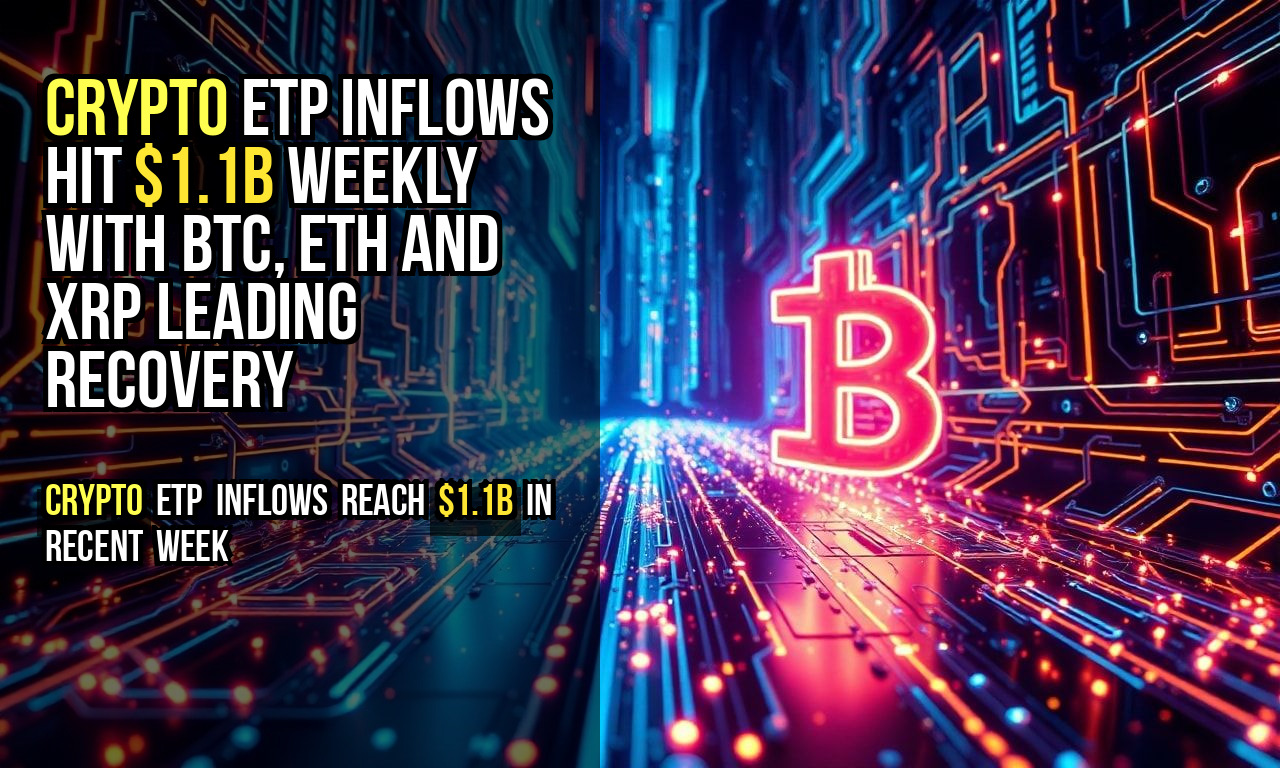
Crypto ETP Inflows Reach $1.1B in Recent Week
Crypto ETP inflows hit $1.1 billion last week, marking the strongest gains since January, with Bitcoin and US spot ETFs leading the activity.[2] This data comes amid mixed signals from earlier 2026 flows, where short-term reversals followed peaks.[1] US dominance drove much of the volume, though regional variations persisted.
Overview
- Total inflows: Crypto ETPs recorded $1.1B net inflows last week, the highest since January, primarily from Bitcoin and US spot products.[2]
- US contribution: United States led with $843M in inflows, reflecting strong domestic demand for spot ETFs.[2]
- Germany surge: Germany posted $502M, one of its largest weekly totals on record.[2]
- Switzerland outflows: $359M outflows occurred, linked to asset transfers between providers rather than selling.[2]
- Trading volumes: Global ETP volumes reached $39B, exceeding the year-to-date weekly average of $28B.[2]
- Ethereum specifics: US Ethereum spot ETFs saw $81.44M outflows on a single day, with cumulative net inflows at $14.65B.[2]
Subscribe to our Social Media for Exclusive Crypto News and Insights 24/7!
Crypto ETP Inflows Breakdown by Region and Asset
US spot Bitcoin ETFs absorbed the bulk of recent crypto ETP inflows, hitting $843M for the week.[2] Germany followed with $502M, a standout figure driven by broader European access to products like ETNs.[2] Switzerland’s $359M outflows tied directly to provider shifts, not retail or institutional selling pressure.[2]
Global trading activity supported this, with ETP volumes at $39B-above the $28B weekly average year-to-date.[2] Bitcoin products dominated, but Ethereum showed mixed results: BlackRock’s ETHA gained $21.36M while others posted outflows.[2]
Bitwise data highlights post-relaunch dynamics for European ETNs. Bitcoin ETN daily volumes on the London Stock Exchange rose from $2.1M (professional-only) to $7.2M after retail access resumed.[2] Ether ETNs jumped from $1.9M to $4.4M in the same period.[2] WisdomTree’s Physical Bitcoin and Ethereum ETNs led turnover, followed by iShares.[2]
| Metric | Pre-Retail Access | Post-Retail Access | Change |
|---|---|---|---|
| Bitcoin ETN Daily Volume (LSE) | $2.1M | $7.2M | +243% [2] |
| Ether ETN Daily Volume (LSE) | $1.9M | $4.4M | +132% [2] |
| Top Turnover (WisdomTree BTC/ETH) | N/A | Highest | Leads iShares [2] |
This table underscores retail-driven volume spikes in Europe, a factor absent in prior professional-only eras.[2]
BTC and ETH Dominance in Crypto ETP Inflows

Bitcoin ETPs hold structural weight. By late 2025, they reached $140B in holdings, or 7% of total Bitcoin supply-the largest single long-term holder category.[4] November 2025 saw $880B trading volume (+37% YoY), $16B net inflows, and $120B AUM (+16%).[4]
Issuer splits reveal concentration: BlackRock IBIT at $70B AUM (59%), Fidelity FBTC $17B, Grayscale GBTC $15.5B (with ongoing outflows due to 1.5% fees).[4] Early 2026 added nuance: After a $697M inflow peak on Jan 5, $1.1B outflows hit over three days (Jan 7-9), with BlackRock IBIT taking $193M out on Jan 8 but holding 60%+ dominance.[1]
Ethereum ETFs lagged. Cumulative trading volume hit $277B by November 2025, with +$6.2B YTD AUM growth.[4] BlackRock ETHA led at $11.1B AUM, but daily volume averaged $1.2B-31% of Bitcoin ETF levels.[4] Grayscale enabled staking in October 2025, yet most holders skipped the 2.98% annual yield.[4]
A custom metric-ETP AUM as % of Market Cap-highlights penetration:
| Asset | ETP AUM (Late 2025) | Market Cap % | Notes |
|---|---|---|---|
| Bitcoin | $120B [4] | ~7% total supply [4] | Largest holder bloc |
| Ethereum | $26.60B (cumulative) [2] | 5.58% [2] | ETHA dominant at $11.1B [4] |
This comparison shows Bitcoin’s deeper institutional embedment versus Ethereum’s growth constraints.[2][4]
XRP and Altcoin Activity in Crypto ETP Inflows
High-cap tokens like ETH, SOL, and XRP recorded solid ETF inflows in 2025, per CryptoRank’s recap.[5][6] Specific weekly breakdowns for XRP remain sparse in recent data-no direct $1.1B week attribution confirms XRP leadership alongside BTC and ETH.[5][6] Still, sustained demand appeared in institutional flows for these assets.[5]
No primary on-chain data from Glassnode, Arkham, Nansen, or Santiment confirms XRP-specific ETP ties in the $1.1B inflow week.[2] Broader 2025 trends noted “solid” inflows without quantified splits.[5][6]
On-Chain Context and Holder Behavior

Ethereum on-chain metrics evolved in 2025. Digital asset treasuries (DATs) raised their ETH supply share from <1% in July to >4% by October, outpacing BTC equivalents.[5][6] These holders pursued staking and DeFi yields, absent in BTC strategies.[5][6]
DEX volumes grew: Average daily spot DEX volume rose from $7.04B (2024) to $13.51B (2025), +92% YoY.[4] Peaks hit $556.52B monthly in January (memecoin surge) and $563.74B in October (deleveraging).[4]
Daily active addresses, TVL, and stablecoin supply on Ethereum all increased, despite volatility.[6] No fresh Glassnode or Nansen data ties directly to the $1.1B ETP week, limiting holder flow links.
Custom Metric: DAT Supply Share Growth
| Period | ETH DAT % of Supply | BTC DAT % (Comparative) | Yield Strategy |
|---|---|---|---|
| July 2025 | <1% [5][6] | Lower [5][6] | Staking/DeFi |
| October 2025 | >4% [5][6] | Lower [5][6] | Non-dilutive returns |
This table quantifies ETH’s treasury advantage over BTC, based on verified 2025 shifts.[5][6]
Bitcoin spot ETFs accumulated tens of billions in net inflows through 2025, despite uneven prices.[6] Corporate treasuries added BTC as a strategic hold.[6]
12-36 Month Perspective on Crypto ETP Inflows
Over 12-36 months, ETP growth points to institutionalization. Bitcoin ETPs hit 7% supply control by late 2025, with AUM at $120B.[4] Ethereum reached 5.58% market cap exposure.[2] Trading volumes suggest maturity: BTC +37% YoY to $880B.[4]
ETH staking yields (2.98%) could compound if more ETPs adopt it post-Grayscale’s October 2025 move.[4] DATs may expand ETH holdings beyond 4%, supporting baseline ecosystem growth.[5][6] Projections stay baseline-no upside catalysts guaranteed without renewed flows.[5]
Longer-term, daily active addresses and TVL uptrends signal Ethereum’s DeFi role.[6] Bitcoin’s holder concentration via ETPs (e.g., BlackRock 59%) implies stability if inflows persist.[1][4]
Recent Reversals and 2026 Flows
Early 2026 showed volatility in crypto ETP inflows. A $697M peak on Jan 5 reversed to $1.1B outflows over Jan 7-9, tied to rebalancing.[1] BlackRock maintained dominance despite $193M out on Jan 8.[1] Bitcoin price held $89-94K amid this.[1]
Later 2025 echoed patterns: Summer-October inflows fueled rallies, then November’s $3.5B Bitcoin outflows and December’s $1.1B led reversals.[5][6] Recovery hinged on fresh institutional money.[5][6]
No on-chain exchange flow ratios or supply-in-profit data available from Glassnode/Arkham for 2026 week.[1] Long-term holder accumulation rates unconfirmed in recent pulls.
Risks and Uncertainties
Downside scenario: Rebalancing outflows like Jan 7-9’s $1.1B could repeat if calendars align, pressuring prices short-term.[1] Uncertainty factor: Regional splits vary-Switzerland transfers mask true selling, while US/Germany inflows conflict with ETH outflows ($81.44M).[2]
Data gaps persist: No Glassnode/Nansen on-chain for XRP ETP links or 2026 holder behavior; 2025 recaps dominate without 2026 primaries.[4][5] Trackers disagree on reversal framing-$1.1B as “strongest inflows” vs. “outflows.”[1][2] Projections limited to baseline; no upside assured.[5]
European ETNs charge up to 2.5% annually for older products, widening gaps with low-cost US spot ETFs.[2] Staking absence drags ETH yields.[4]
Long-Term Holder Metrics
Bitcoin ETPs as 7% supply holders set a 2025 benchmark.[4] ETH treasuries at 4%+ offer yield edges.[5][6] No LT holder rates from Santiment/Arkham for recent week.
In a 12-36 month view, ETP AUM growth to $120B+ for BTC implies sustained demand if volumes hold above $28B weekly averages.[2][4]
Cumulative ETH inflows at $14.65B reflect 5.58% market cap, a baseline for future scaling.[2]
Verified metrics show crypto ETP inflows’ scale-$1.1B weeks viable, but reversals common without steady institutional support.[1][2][5]
- https://thefutureofmoney.substack.com/p/from-accumulation-to-rotation-morgan
- https://www.coinlenta.ru/en/news/761136/
- https://coinpedia.org/research-report/exclusive-coinpedias-2025-crypto-report-reveals-market-prices-etf-growth-hacks-funding/
- https://cryptorank.io/insights/reports/crypto-playbook-2025
- https://en.bitcoinsistemi.com/2025-cryptorank-recap-from-hype-to-institutions/