Ethereum’s Market Analysis and Trends
Ethereum is currently trading at $2,265 with a market capitalization of $272 billion. Its 24-hour trading volume is $19.24 billion, and its value is fluctuating between $2,170 and $2,310. As the anticipation of a spot bitcoin exchange-traded fund (ETF) approval grows, Ethereum, along with other cryptocurrencies, is experiencing volatility similar to Bitcoin.
Market Sentiment and Moving Averages
Oscillators such as the RSI and Stochastic indicate neutral market sentiment, while the CCI and MACD show bearish signals. However, the momentum indicator hints at a bullish outlook. Overall, the market is in a state of indecision, waiting for a clear trend or trigger.
Trends in Short and Long-term Averages
Short-term moving averages, like the 10 and 20-day, reflect a bearish trend due to recent price drops. However, longer-term averages from the 30-day onward suggest a dominance of bulls. This indicates potential short-term bearishness but the possibility of medium to long-term recovery or growth.
Chart Analysis
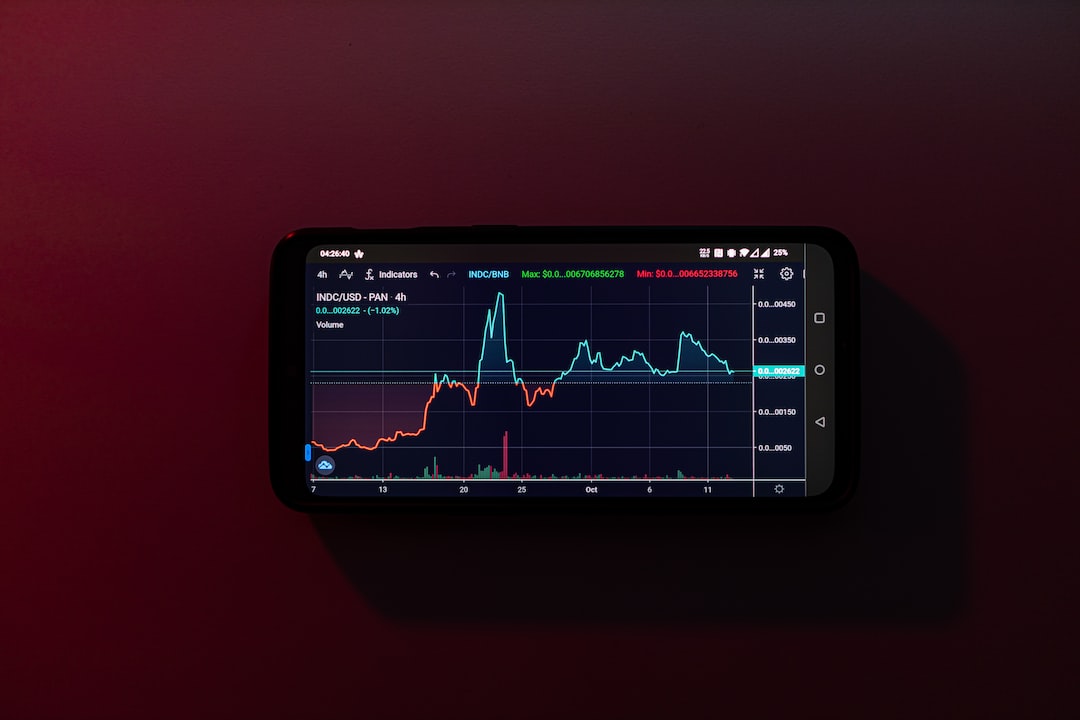
Ethereum’s daily chart shows a volatile market with significant price swings, including a recent sell-off followed by a slight recovery. The lack of a definitive trend in the daily chart indicates a market struggling to find direction, providing strategic entry and exit points for traders. Zooming into the 4-hour chart, recent bullish rises suggest a potential trend reversal and reduced volatility. The 1-hour chart reveals a clear uptrend with increasing volume, indicating positive momentum for Ethereum.
Bull and Bear Verdict
Bull Verdict: Despite short-term turbulence and mixed signals, Ethereum displays resilience in the face of market volatility. Promising longer-term moving averages and a budding uptrend on the 1-hour chart suggest the potential for upward momentum. Traders may view dips as opportunities to capitalize on, keeping an eye on emerging bullish patterns.
Bear Verdict: Ethereum’s price analysis highlights a challenging landscape, with immediate bearish signals from short-term moving averages and a significant sell-off on the daily chart. Neutral oscillator readings indicate a lack of strong buying momentum, potentially leading to further consolidation or decline. Traders should exercise caution and prepare for potential downside risks.
Hot Take: Ethereum’s Volatility Reflects Bitcoin ETF Anticipation
Ethereum’s current volatility can be attributed to the increasing anticipation surrounding the potential approval of a spot bitcoin exchange-traded fund. As the market awaits the decision, Ethereum’s market sentiment, moving averages, and chart analysis provide valuable insights for traders. Whether you see it as an opportunity to capitalize on dips or a landscape with bearish signals, staying informed and vigilant is crucial in navigating the evolving crypto market.


 By
By

 By
By

 By
By
 By
By