The Bullish Triple-Bottom Pattern of Cardano (ADA)
The price of Cardano (ADA) has formed a bullish triple-bottom pattern within the $0.24 support area, which has been in place since the beginning of the year. This pattern indicates a potential positive reaction in the price.
Cardano’s Price Analysis
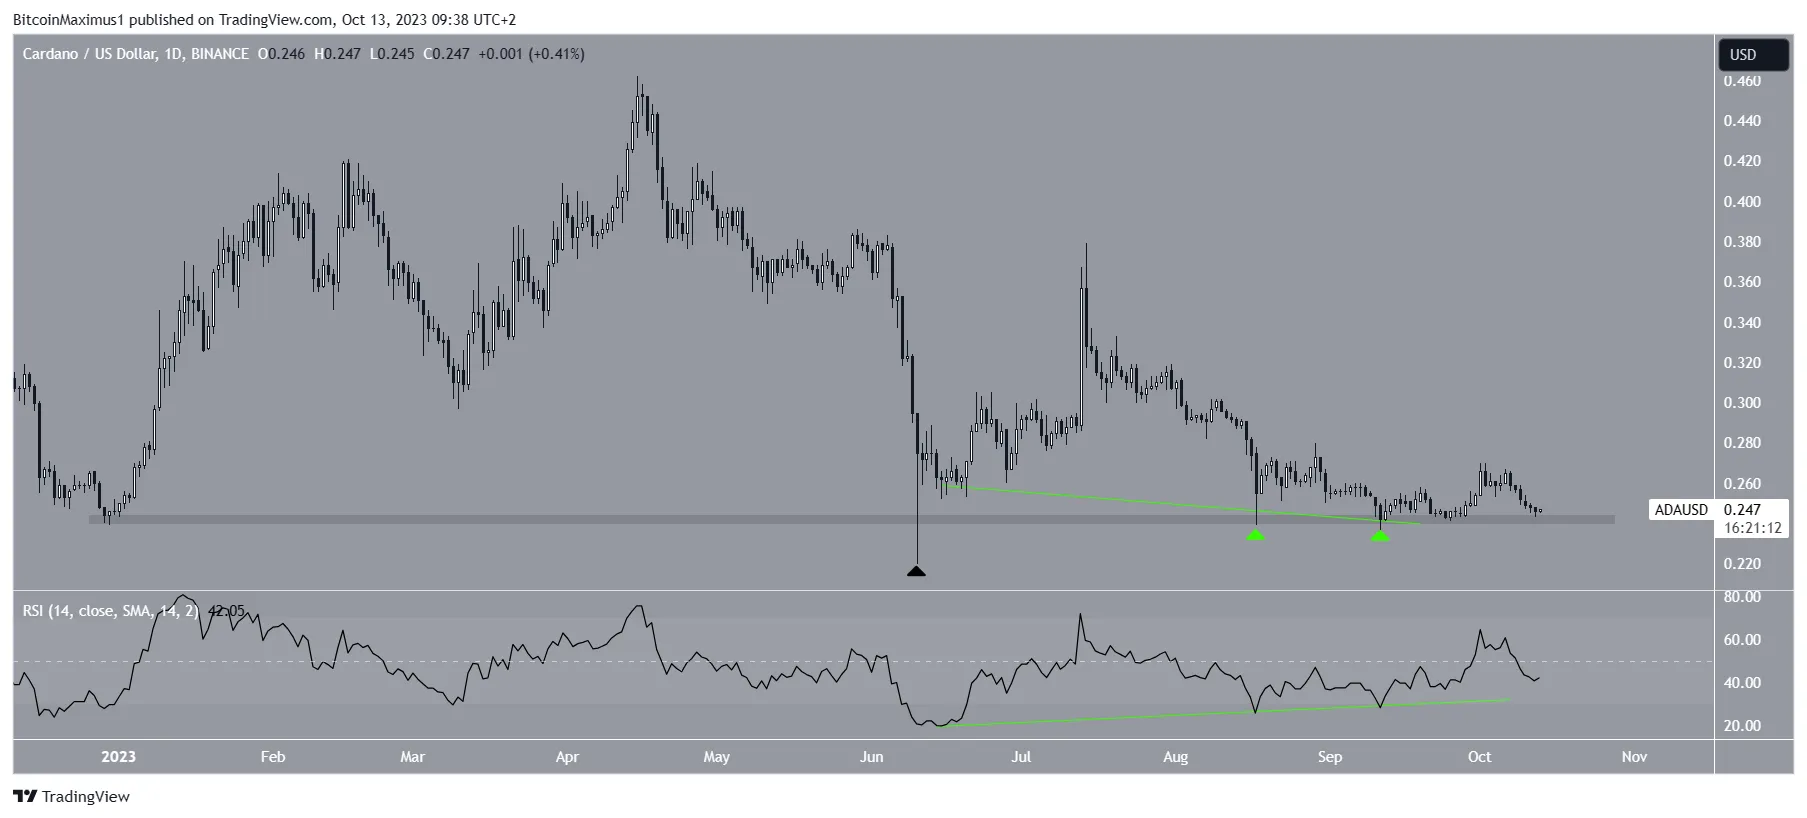
An analysis of ADA’s daily chart shows that its price has been declining since reaching a yearly peak of $0.46 in April. The decline reached a low point of $0.22 on June 10.
After this drop, ADA experienced a rebound and confirmed the $0.24 level as a support zone. It revisited this support area twice on August 17 and September 11, creating a triple bottom pattern, which is typically seen as bullish.
Despite this pattern, ADA has not shown any upward movements yet.
Cardano Founder’s Concerns and Midnight Protocol
In recent news, Cardano founder Charles Hoskinson expressed his shock at what he perceives as unfair media coverage of Sam Bankman-Fried, calling him “The Bernie Madoff of my generation.” Additionally, Hoskinson introduced a new privacy-focused sidechain called Midnight Protocol, based on Freedom of Association, Commerce, and Expression.

Bullish Signals from the Relative Strength Index (RSI)
The daily RSI suggests a bullish trend for ADA. Traders use the RSI as a momentum indicator to determine whether a market is overbought or oversold. An RSI reading above 50 during an upward trend favors bulls, while a reading below 50 indicates bears are in control.
Notably, the RSI has shown significant bullish divergence during the formation of the triple bottom pattern. This divergence suggests a potential reversal towards a bullish trend.
Short-Term Breakout and Price Prediction
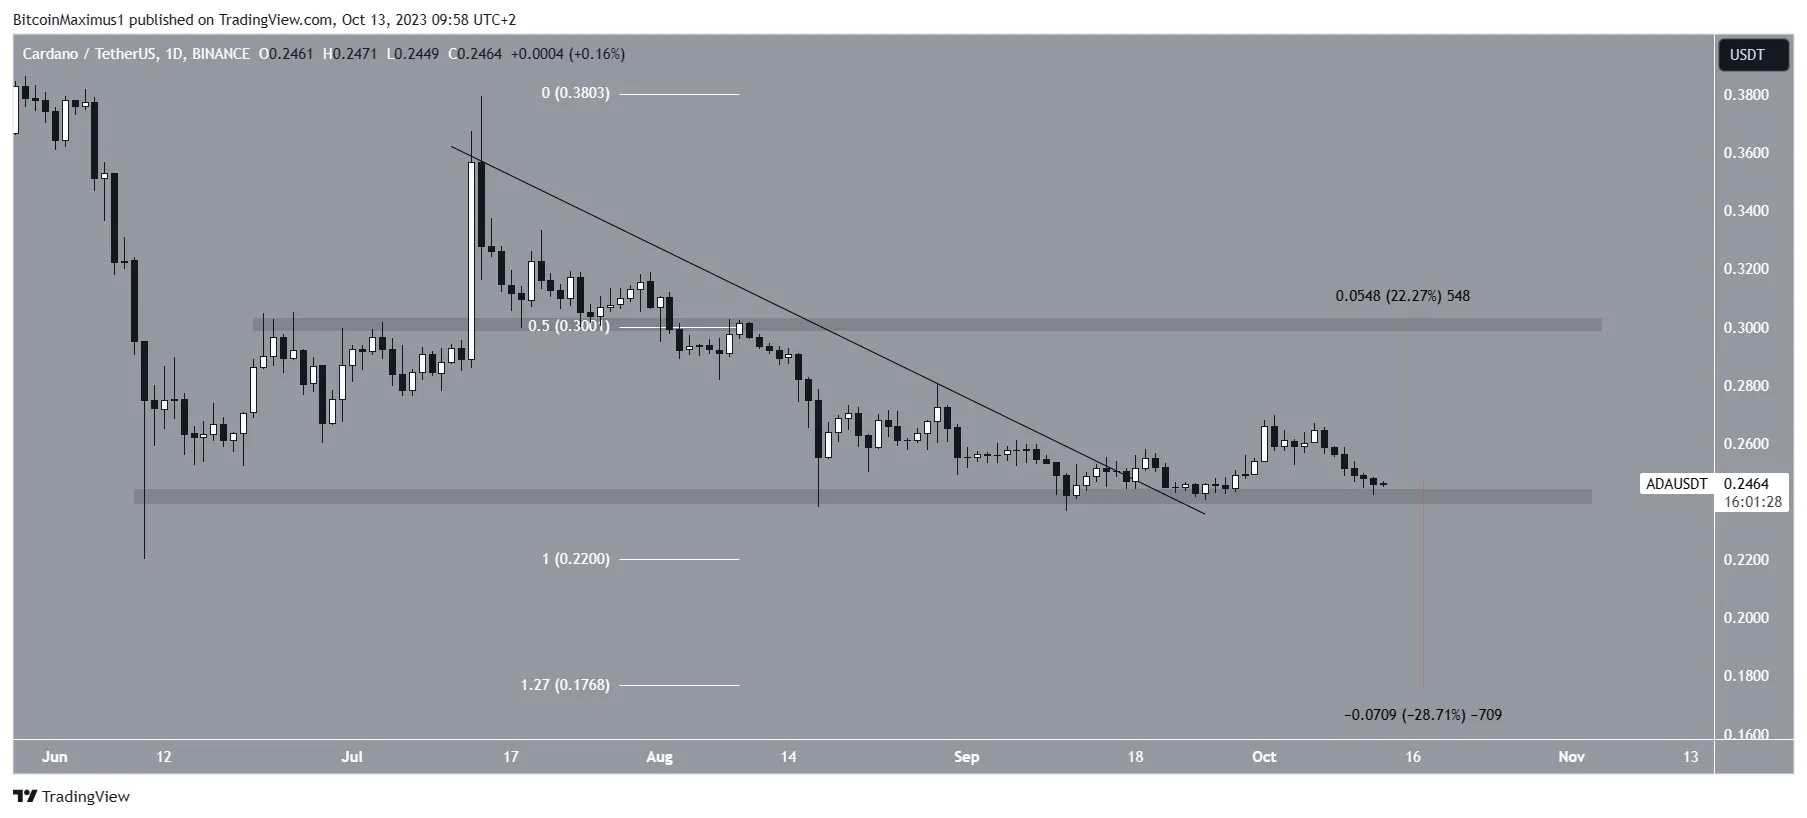
In September, ADA broke out from a descending resistance trendline. Although it didn’t immediately increase, it gained momentum in early October, reaching a high of $0.27 on October 2.
The most likely future movement for ADA is an upward push towards the $0.31 resistance zone, which corresponds to the 0.5 Fibonacci retracement resistance level and a horizontal resistance area.

The Importance of $0.24 Support Zone
It’s crucial to note that if the price falls below the $0.24 horizontal support zone, it would invalidate both the longer-term triple bottom pattern and the short-term bullish outlook. In this scenario, a decline to $0.18 becomes more likely.
Hot Take: Reversal Potential with a Short-Term Breakout
The price of Cardano (ADA) has formed a bullish triple-bottom pattern within the $0.24 support area, indicating a potential positive reaction. The daily chart analysis and RSI divergence suggest a reversal towards a bullish trend. A short-term breakout from a descending resistance trendline also supports the upward movement.
If ADA successfully reclaims the $0.31 resistance zone, it would confirm the triple bottom pattern and validate the overall bullish trend reversal. However, falling below the $0.24 support zone would negate these patterns, potentially leading to a further decline.


 By
By
 By
By
 By
By
 By
By
 By
By
 By
By