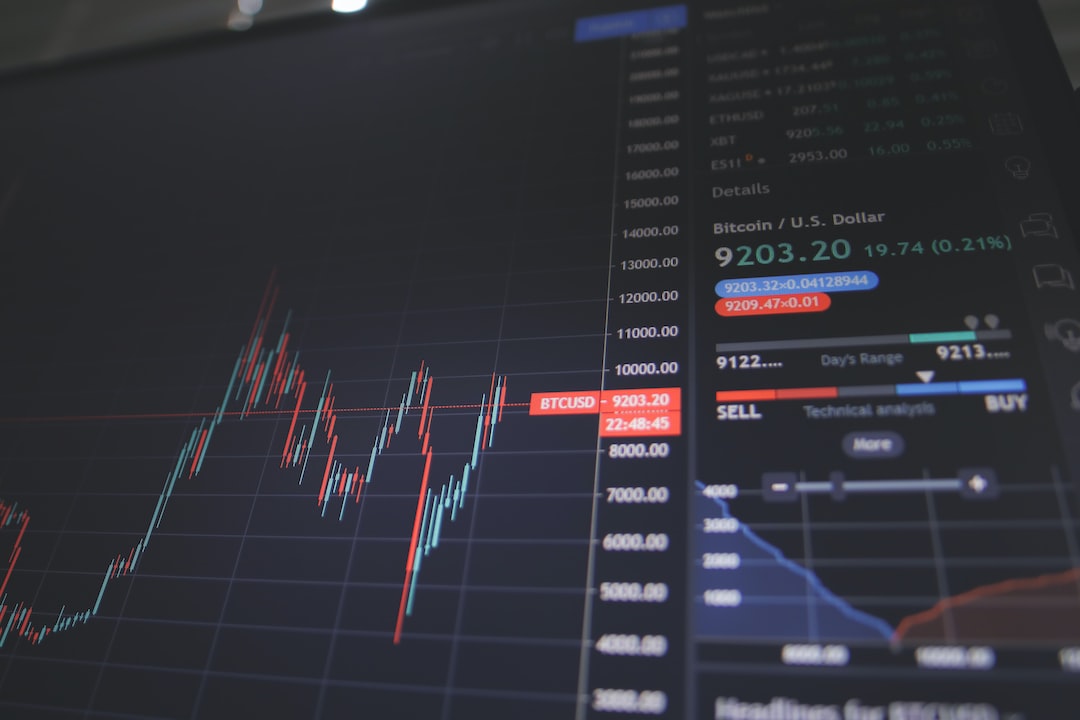
Bitcoin (BTC) Price Analysis: Technical Holding Pattern
Bitcoin (BTC/USD) is continuing its sideways trading activity, unable to test significant technical levels. The recent high around $49,102.29 was the strongest print since late December 2021. Trading activity has been revolving around the $42,715.80 area, which is a downside price objective related to recent selling pressure. After a dip to the $41,208.59 area, buying pressure emerged around $42,495, an upside price objective related to recent buying activity.
Large Stops Elected Above Significant Technical Levels
Several significant technical levels were breached during the recent move to multi-year highs, including $47,934, $48,466, and $48,647.72. Upside price objectives include $51,701, $52,121, $52,971, and $53,370. Areas of technical support and potential buying pressure can be found at $41,208, $39,343, and $36,329.
Current Technical Indicators
The 50-bar MA (4-hourly) is indicating bullishness above the 100-bar MA (4-hourly) and the 200-bar MA (4-hourly). On the other hand, the 50-bar MA (hourly) is indicating bearishness below the 200-bar MA (hourly) and above the 100-bar MA (hourly).
Price activity is closest to the 200-bar MA (4-hourly) at $43,422.71 and the 100-bar MA (hourly) at $42,745.39.
Technical Support and Resistance Levels
Technical support is expected around $40,625.68, $37,321.80, and $34,950.00, with stops expected below. Technical resistance is expected around $51,707.77, $52,121.96, and $53,370.28, with stops expected above.
Current Chart Signals
On the 4-hourly chart, SlowK is bearishly below SlowD, while MACD is bullishly above MACDAverage. On the 60-minute chart, SlowK is bullishly above SlowD, while MACD is bearishly below MACDAverage.
Hot Take: Bitcoin’s Sideways Trading Continues
Bitcoin has been stuck in a technical holding pattern, with no significant breakthroughs in either direction. Despite recent selling pressure and attempts at testing key levels, BTC/USD has failed to make a strong move. While support and resistance levels remain intact, traders are closely watching the current technical indicators for potential future movements. With the 50-bar MA (4-hourly) signaling bullishness and the 50-bar MA (hourly) indicating bearishness, the market could still go either way. As Bitcoin continues its sideways trading, investors are eagerly awaiting a breakout that could drive prices towards new multi-year highs.


 By
By
 By
By
 By
By

 By
By
 By
By