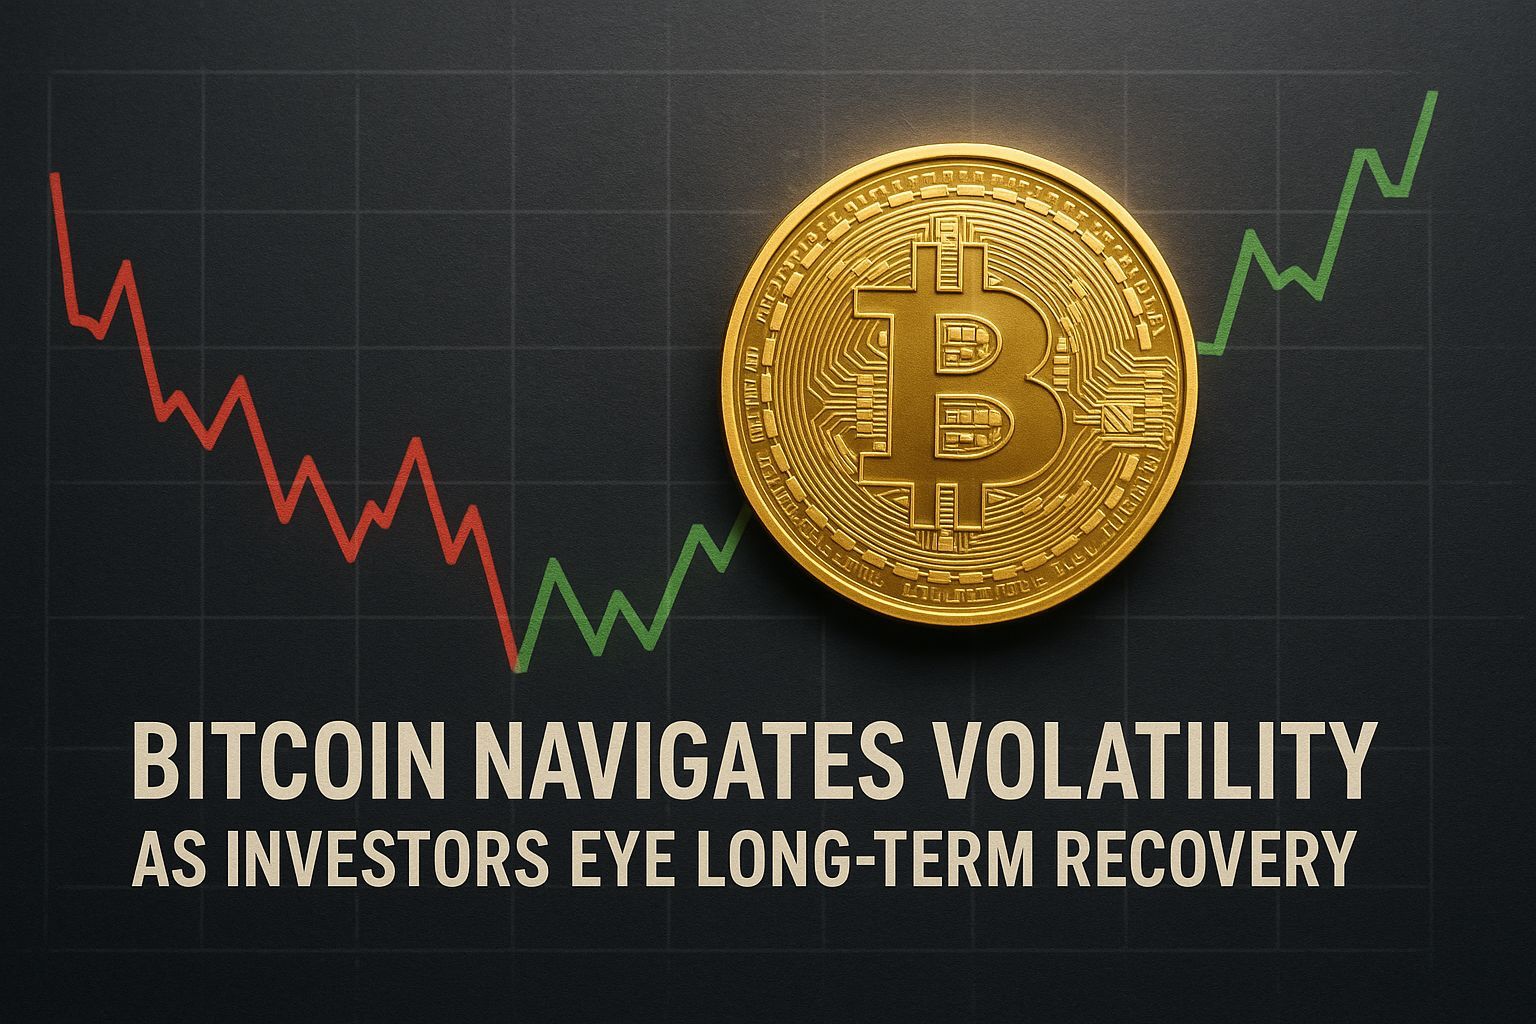
Bitcoin’s February Crossroads: Can Institutional Demand Spark a Recovery?
The Setup: Consolidation Beats Capitulation
Bitcoin’s currently sitting around $88,000-$89,000, and honestly, that’s not where bulls wanted to be heading into February[1][2]. The asset failed to hold above $100,000 in January-a rejection that triggered profit-taking and pushed BTC into what analysts are calling a consolidation phase[1]. But here’s the thing: the narrative’s starting to shift. Instead of the aggressive selling we’d normally expect after a failed breakout, price behavior has stabilized[1]. That matters more than you’d think.
The real story isn’t about the bounce; it’s about what stopped the bleeding. Institutional selling pressure through spot Bitcoin ETFs is weakening. In November 2025, ETFs saw $3.48 billion exit. December added another $1.09 billion. But January? Just $278 million in outflows[1]. That deceleration is the kind of signal that separates capitulation from consolidation. If ETF flows turn positive in February, you’re looking at structural support that could reinforce stability and improve upside probability[1].
Subscribe to our Social Media for Exclusive Crypto News and Insights 24/7!
Key Takeaways
- Bitcoin faces a critical technical level: it needs to reclaim $90,000 and break above the 100-day moving average near $94,000 to signal a genuine reversal[2]
- ETF outflow deceleration suggests institutional selling pressure is weakening-a potential tailwind for February[1]
- Historical data shows February averages 14.3% returns for Bitcoin, suggesting a similar move would target $101,000[1]
- Macroeconomic headwinds (interest rate expectations, Fed policy) and geopolitical risks remain near-term bearish pressures[2]
- A breakout from the ascending broadening wedge could open doors to $98,000-$101,000, but consolidation near $95,000 would be critical before larger moves[1]
The Technical Picture: Wedge, Trendlines, and Psychological Levels
Bitcoin’s trading within an ascending broadening wedge, and price recently bounced off the lower boundary[1]. That’s textbook technical support, but don’t get too comfortable. The 50-day moving average is currently above price on the daily chart and falling-that’s resistance disguised as moving average[4]. On the weekly timeframe though? The 50-day MA is rising since mid-2025, which suggests longer-term strength if price can hold above it[4].
Here’s where it gets interesting for February. Bulls need to clear three checkpoints:
First checkpoint: $89,241 and the psychological $90,000 level. Acceptance above $90,000 would confirm strengthening momentum[1]. You’ve seen this before, right? BTC teasing the round number, shaking out weak hands, then finally breaking through.
Second checkpoint: The 100-day moving average near $94,000. This is where the real battle lives. Analysts suggest that breaking above this level would signal a bullish reversal and take pressure off the downside[2]. If Bitcoin loses this, a bearish rising wedge could trigger renewed selling unless price breaks above $98,000[2].
Third checkpoint: $98,000-$101,000. If the wedge breaks decisively upward, the first major upside target sits near $98,000[1]. Reaching that would likely spark a controlled pullback toward $95,000 to establish durable support[1]. That consolidation zone is critical-it’s the foundation for larger continuation moves.
Some analysts are even more ambitious. An ascending trendline holding could theoretically push Bitcoin toward $136,000[2], though that’s contingent on macro conditions improving and institutional demand staying strong.
The ETF Question: Is Institutional Demand Coming Back?

Here’s what’s fascinating: while retail traders are rotating in and out, persistent corporate and institutional buying is still happening even as ETF flows turn negative[2]. That’s a mixed signal worth unpacking.
Spot Bitcoin ETFs recorded persistent net outflows over the last three months-$3.48 billion in November, $1.09 billion in December. But the deceleration to just $278 million in January is telling[1]. It suggests institutional selling pressure has exhausted itself. The question for February: do inflows return?
The mechanics matter here. Without ETF inflows absorbing supply, Bitcoin faces greater downside pressure[3]. But if institutional capital rotates back in-especially following sentiment shifts around Fed policy or geopolitical developments-you’re looking at structural support that can sustain a rally[1].
BlackRock’s IBIT and other major ETF products have been the steady bid under crypto’s price floor. When that bid disappears, liquidity dries up fast. You’ve likely seen that in January when BTC ETFs recorded a daily net outflow of $818 million on January 29-the largest daily outflow since November 20[3].
Macro Headwinds and Geopolitical Noise

Let’s be real: Bitcoin’s not trading in a vacuum. Macroeconomic fears around interest rates have fueled significant outflows from global crypto ETFs[2]. Lower expectations of rate cuts from the Fed have weighed heavily on sentiment. Add in Trump’s tariff rhetoric, nominations like Kevin Warsh’s (an inflation hawk), and concerns about global economic health, and you’ve got a crowded macro calendar[3].
That said, there’s a silver lining some analysts are highlighting. If Warsh’s policies reduce the Fed’s balance sheet and opt against further rate cuts, that could be bullish for Bitcoin long-term[3]. The theory: less aggressive Fed tightening might eventually drive investors toward hard assets like BTC.
But short-term? The FOMC meeting in 2026 could further influence market sentiment[2]. Until we get more clarity on Fed policy and inflation, macro uncertainty remains a headwind for sustained rallies.
The Liquidation Cascade and Options Market Dynamics
This is where derivatives get spicy. Once key support levels were broken, options activity accelerated selling pressure-a classic liquidation cascade[2]. That’s not conspiracy thinking; it’s how leveraged markets work. When liquidation engines kick in, they amplify moves in both directions.
Glassnode’s noted that activity in the options market puts Bitcoin’s price at risk of further decline[3]. Options positioning suggests traders are hedging downside more aggressively than upside[3]. That’s a tell-smart money’s protecting itself against deeper drawdowns.
Here’s the brutal math: if Bitcoin slips below key support levels without institutional bid cushioning the fall, derivatives could trigger cascading liquidations down to lower levels. Some veteran traders like Peter Brandt have predicted Bitcoin could drop to the $60,000 range if macro conditions deteriorate significantly[3]. That’s not a call I’m making; that’s what the tape’s showing experienced analysts.
The Bottom-Up View: Where’s the Liquidity?
Analyst Michaël van de Poppe made an interesting observation: Bitcoin’s taken all the key liquidity levels and doesn’t need to drop below $80,000 to have enough liquidity for a bullish reversal[3]. The takeaway? The capitulation low might already be in the books. The flagship crypto needs to break above $87,000, which could then put the psychological $100,000 level back in focus[3].
That’s a more optimistic take than the derivatives data suggests, but it’s worth considering. Sometimes the scariest bottoms are the quickest bounces.
What February Really Needs
Honestly, this month’s all about stabilization. Bitcoin doesn’t need to moon-shoot to $120,000 to win in February-it needs to prove it can hold support, attract ETF inflows, and clear $90,000-$94,000 without faking out again.
Historical data’s encouraging: February’s Bitcoin’s best month, averaging 14.3% returns[1]. If we see even half of that, we’re targeting $101,000[1]. But that’s only if macroeconomic conditions stabilize and institutional capital stops fleeing.
The scenario that feels most likely? Bitcoin consolidates in the $88,000-$95,000 range through mid-February while ETF flows decelerate further toward positive territory. By late February, if Fed commentary improves or macro data surprises to the upside, you could see a breakout toward $98,000-$101,000. The wedge breaks bullish, and durable support gets established at $95,000.
The bear case? Macro fears intensify, ETF outflows resume, and Bitcoin retests lower support without institutional support. In that scenario, you’re looking at the levels van de Poppe mentioned-$80,000, maybe lower.
But investors eyeing long-term recovery should remember: every major crash in Bitcoin’s history has eventually reversed. The question isn’t whether recovery comes. It’s when-and whether you’re positioned for it.


