When Leverage Gets Reset: What Bitcoin’s Recent OI Flush Actually Means for Traders
Bitcoin’s perpetual futures market just experienced something that doesn’t happen often-a controlled deleveraging event that wiped roughly $15 billion off open interest in a matter of days. But here’s the thing: this wasn’t panic. This was a necessary reset that’s reshaping how traders should position themselves going forward.
Key Takeaways
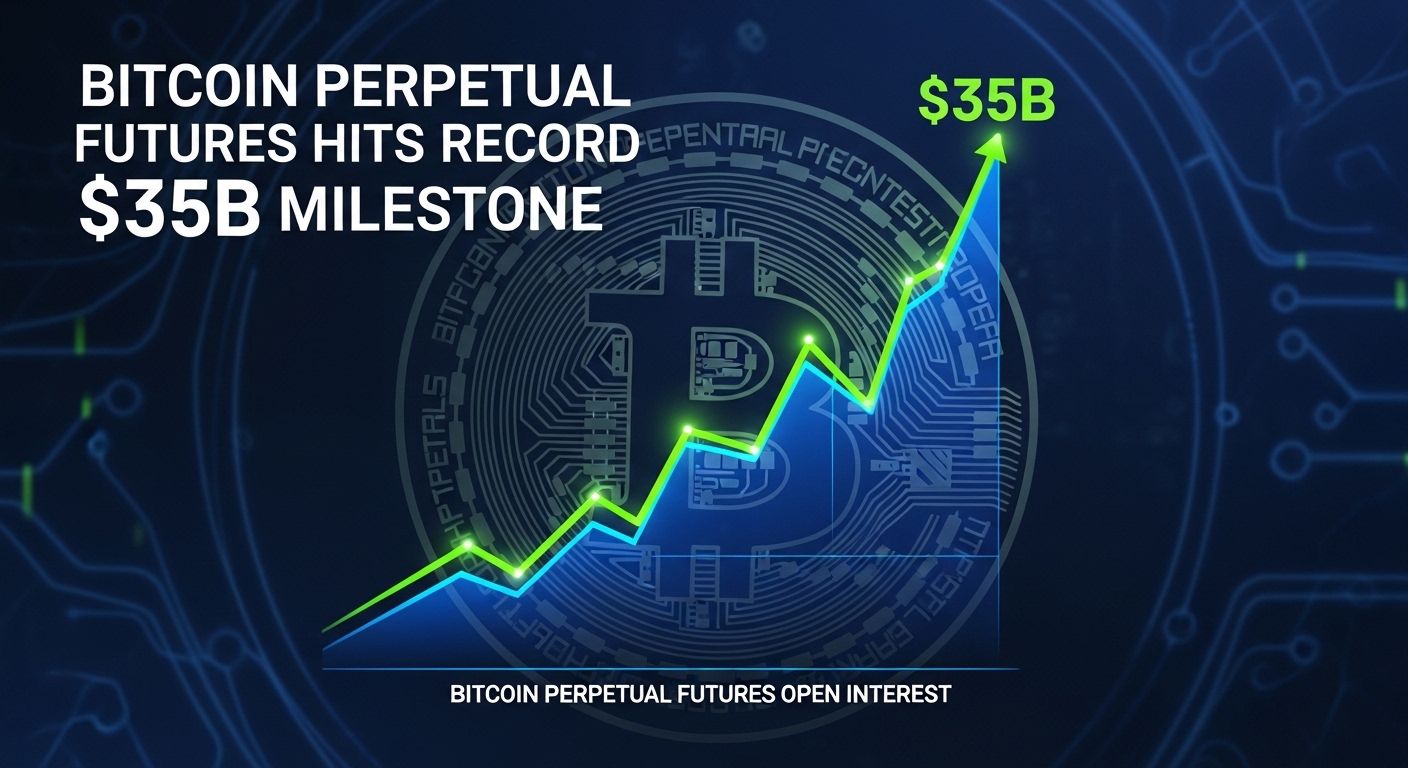
• Bitcoin consolidated below $105K following leverage liquidations, with open interest declining from approximately $50B to $35B, indicating forced position closures and reduced speculative exposure.
Subscribe to our Social Media for Exclusive Crypto News and Insights 24/7!
• Bitcoin’s spot ETF inflows reached $338M on October 14 with BlackRock’s IBIT exceeding $100B in assets, signaling institutional demand remained stable despite derivatives market stress.
• Funding rates compressed to near-neutral (+0.003%) after two weeks of negative territory, suggesting trader sentiment reversed from long-biased leverage to balanced positioning.
• Bitcoin dominance climbed to 58.9% amid the flush, the highest level in this cycle, reflecting capital reallocation from altcoins into institutional-grade spot holdings.
• BTC consolidated within the $68.5K-$71.2K range with realized price support at $67,200, establishing key technical levels where institutional cost-basis anchors and derivative liquidation cascades cluster.
The Flush Nobody Saw Coming (But Everyone Felt)
Last October, something clicked. Bitcoin had spent months stacking leverage-perpetual futures open interest ballooning toward $50 billion as traders convinced themselves the bull run had legs. Then reality hit. In a matter of hours, liquidations rippled through every major offshore exchange. Binance’s BTC/USDT perpetual contract hit a 5.1% discount to spot, the widest deviation since March 2020.[2]
What makes this different from typical crashes? The data tells you. The wipeout that crushed open interest from $50B down to $35B showed controlled risk management, not panic selling.[2] Offshore traders took the heaviest hits while CME and spot ETF flows remained steady. That’s institutional buyers sleeping soundly while leveraged retail got shaken out.
Think about it: if this were a genuine crash, you’d see spot ETFs bleeding capital. Instead, Bitcoin spot ETFs absorbed $338M in inflows on October 14 alone, with BlackRock’s IBIT (the biggest Bitcoin ETF) crossing $100B in total assets under management.[2] That’s not capitulation. That’s consolidation.
The Leverage Reset Nobody’s Talking About
Here’s where it gets interesting for traders building positions: funding rates got weird before they got normal.
After the flush, annualized funding turned sharply negative-meaning traders were paying to stay short after bullish leverage was wiped out.[2] This extreme reset typically marks peak fear and the final stages of deleveraging. Historically, when funding rates reset this hard, you get a market rebalancing rather than a new crash. The excess leverage gets cleansed. The market structure gets healthier.
By late February, funding normalized around +0.003%-basically neutral.[4] Open interest declined 8% week-over-week, suggesting deleveraging was actually complete.[4] That’s the signal nobody broadcasts: when derivatives positioning normalizes after a flush, it often precedes a recovery phase.
Compare this to August 2024, when Bitcoin’s open interest in futures sat at $27.75 billion with daily spot volume around $40.44 billion.[5] The current $35B open interest level represents meaningful growth in derivatives activity, but it’s not the excessive leverage you’d want to short into.
Dominance Shift: Bitcoin’s Moat Gets Wider

While altcoins got decimated, Bitcoin dominance climbed to 56.5%, then hit 58.9% at cycle highs.[2][4] This is classic barbell behavior: capital flows to the safest asset (BTC spot) and the riskiest (micro-cap speculation). The mid-cap altcoin space? That got caught in the middle and bled hard.
Exchange netflows show institutional accumulation patterns too. Over a 72-hour window, major venues saw a net outflow of 12,400 BTC-sounds bearish, right? Except this reflects withdrawal into self-custody, not capitulation sales.[4] Realized price anchored at $67,200 provides institutional cost-basis support.[4] When you’ve got $35B in open interest sitting above realized price, you’ve got structural support.
The Technical Picture: Compression Before Expansion
Bitcoin spent seven consecutive sessions consolidating in the $68.5K-$71.2K range after the early February drawdown from $76K.[4] This kind of compression often precedes directional moves. Break above $71.2K on volume exceeding $35B in daily spot trading, and the market targets $73.4K.[4] Loss of $68.5K likely cascades to $65.8K demand zone.
The thing about these liquidation levels? They cluster. When leverage unwinds, it doesn’t unwind evenly. There are bands-zones where cascading liquidations concentrate. Gamma density at defined strike levels in options markets also creates friction points. Bid/ask depth imbalances widen near these zones, meaning slippage becomes a real risk for large institutional positioning.
What This Means for Your Positioning
The narrative that Bitcoin’s derivatives market got “destroyed” misses the mark. What actually happened was a repositioning. The market went from overly long and leveraged to healthier structural positioning. Institutional spot buying continued. Funding normalized. Open interest stabilized at levels that still reflect genuine hedging and speculation, but without the explosive leverage buildup.
If you’re building positions, this is the environment where you pay attention to where open interest is clustering. Is it piling into calls at $80K? Puts at $60K? That asymmetry tells you where the market’s real anxieties live. Funding rate compression to neutral from negative is typically a bullish signal-it means leverage was the thing killing momentum, not fundamentals.
The next event catalyst to watch? ETF flows. Spot ETF inflows for all of 2025 reached about $6.96B.[2] If macro stability holds and risk sentiment improves, you could see those flows accelerate. Once that happens, watch whether altcoin spot ETF approvals resume-the search results hint that institutional demand’s been building for non-BTC products, and the flush might’ve just cleared the excess leverage blocking the next leg.
Bitcoin didn’t break. It just shook off the passengers who were holding with borrowed money.
- https://www.btcc.com/en-US/square/Cryptopolitan/1564984
- https://www.fxstreet.com/cryptocurrencies/news/bitcoin-weekly-forecast-btc-slips-below-105-000-as-macro-headwinds-weigh-on-sentiment-202510171025
- https://sacra.com/c/binance-holdings-ltd/
- https://www.mexc.co/en-PH/news/718811
- https://www.xbto.com/resources/ethereum-at-a-crossroads-institutional-adoption-vs-market-underperformance
- https://www.blockscholes.com/research/bybit-x-block-scholes-crypto-insights-report-deep-dive-into-us-crypto-regulations


