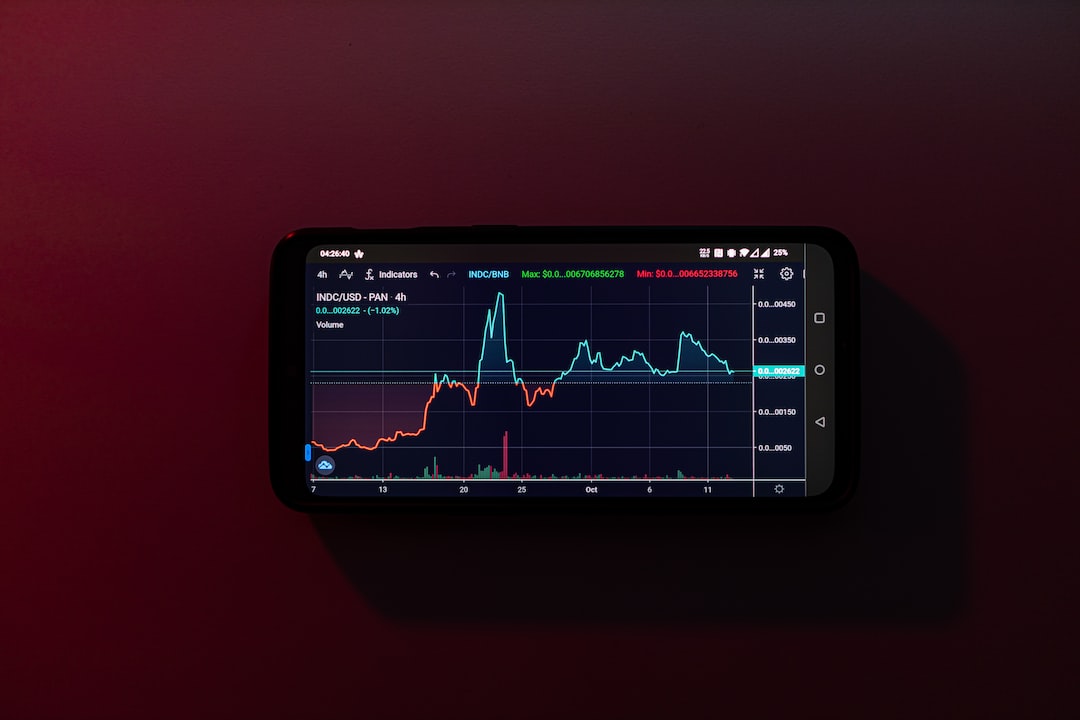
Bitcoin (BTC/USD) Continues to Face Bearish Momentum
In the Asian session, Bitcoin (BTC/USD) experienced further bearish momentum as the pair continued to depreciate. This decline followed significant selling pressure that began around the 27500 area and intensified at levels such as 27393, 27304, 27108, and 26795. As a result, stops were triggered below various downside price objectives associated with these levels.
Some of the downside price objectives that were breached include areas like 26750, 26726, 26677, 26603, 26586, 26549, 26387, and 26368. Other potential downside targets to watch out for are at levels such as 26286, 26204, 26101, 26059, and 25990. However, there was a temporary pause in selling pressure around the 26359.70 area when the price reached the 200-bar, 4-hour simple moving average.
Key Support and Resistance Levels
The market has established stops below the level of 24197.68, which is a downside price objective resulting from selling pressure near the 30222 area. Additionally, there are large stops positioned beneath the levels of 26286 and 25668. Traders should also consider other price objectives below the current market value at areas like 24511, 24339, 23164, 22949, 21496, and 20702.
Technical Indicators
Traders are currently observing bullish signals from multiple moving averages. The 50-bar MA (4-hourly) is indicating above the 100-bar MA (4-hourly) and the 200-bar MA (4-hourly). Similarly, the 50-bar MA (hourly) is indicating above the 100-bar MA (hourly) and the 200-bar MA (hourly).
Based on technical analysis, the price activity is closest to the 50-bar MA (4-hourly) at 26666.21 and the 200-bar MA (hourly) at 26858.27.
Support and Resistance Levels
Technical support is expected around levels such as 24440.41, 23270.10, and 22769.39. Traders should be aware of potential stops below these levels. On the other hand, technical resistance is anticipated around levels like 31986.16, 32989.19, and 34658.69. Stops are expected to be positioned above these resistance levels.
Technical Analysis
In terms of technical indicators, on the 4-hourly chart, SlowK is bearishly below SlowD while MACD is bearishly below MACDAverage. However, on the 60-minute chart, SlowK is bullishly above SlowD while MACD is bearishly below MACDAverage.
Sally Ho’s Technical Analysis
To read Sally Ho’s technical analysis for today’s trading, please follow this link.
Hot Take: Bitcoin Continues to Face Selling Pressure
Bitcoin (BTC/USD) has been experiencing a downward trend with significant selling pressure in recent trading sessions. The price has breached various downside objectives and triggered multiple stops along the way. Although there was a brief pause in selling pressure around a key moving average, the overall bearish momentum remains strong.
Traders should closely monitor the support and resistance levels, as well as the signals from various moving averages. Technical indicators suggest that the market is currently bearish, with potential for further downside. It will be interesting to see if Bitcoin can find support and reverse the trend in the coming sessions.


 By
By
 By
By
 By
By
 By
By

 By
By