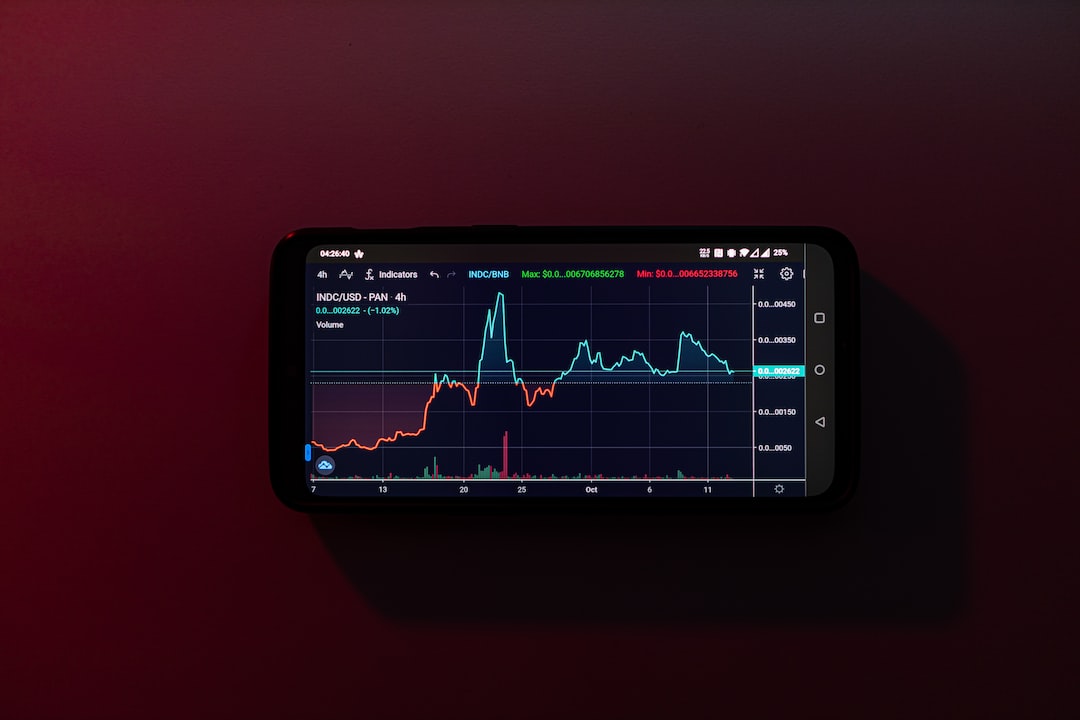
Bitcoin at a Critical Juncture: Will it Crack?
Bitcoin is currently facing a bearish head-and-shoulder pattern in the weekly chart, according to analyst Tony Spilotro. If this pattern is realized, it could push prices below a critical support line, potentially reaching $18,000 or lower in the coming weeks. Traders are advised to adopt a wait-and-see approach before making any moves.
Bitcoin’s Stability and Uptrend
As of August 15, Bitcoin is stable and within a broader uptrend, as seen in the daily chart. It is currently trading within a range established between June and July 2023. Despite some sideways movement, BTC remains above the $28,000 support level. A breakout above $32,000 with increasing volumes could lead to demand and potential price gains.
Doubts Over Bullish Prospects
The potential formation of the head and shoulder pattern in the weekly chart raises doubts about the bullish prospects for Bitcoin. Traders remain cautiously optimistic due to the vulnerability suggested by the candlestick arrangement, particularly in the weekly timeframe. Market sentiment and hopes for sustained growth could be affected.
Fundamental Factors Complicating the Outlook
Inflation in the United States and the potential for interest rate hikes by the Federal Reserve complicate the outlook for Bitcoin’s price. The Fed’s recent rate hikes and commitment to curbing inflation may impact the crypto market. Additionally, Bitcoin’s upcoming halving in 2024 could cause a supply shock and support prices in the second half of next year.
Hot Take: Bitcoin’s Future as a Risky Asset
While Bitcoin has the potential to serve as a store of value during times of crisis, analysts still view it as a risky asset. The events in 2022, when Bitcoin experienced a significant drop in price, serve as a reminder of the potential impact of the Federal Reserve’s tightening policy. Traders and investors should proceed with caution and closely monitor market developments.


 By
By
 By
By
 By
By
 By
By

 By
By