Cardano (ADA) Triangle Pattern Suggests Imminent Breakout
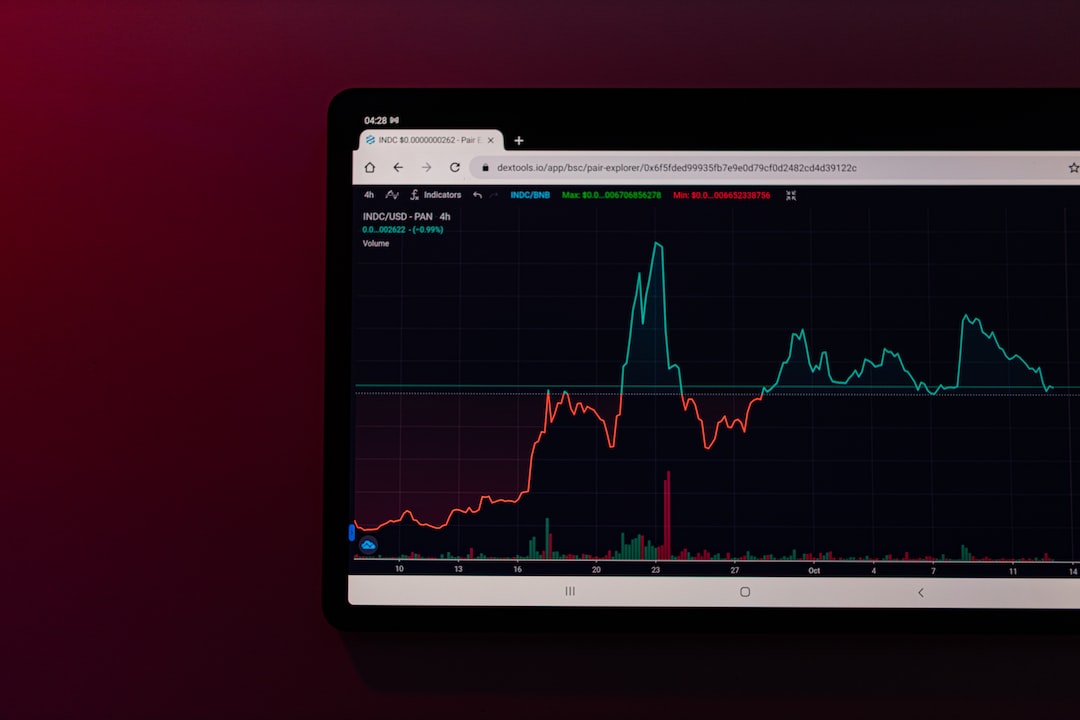
Cardano (ADA) enthusiasts are eagerly watching the charts as the cryptocurrency’s price forms a distinctive triangle pattern, suggesting an imminent breakout that could mark a significant shift in its trajectory. This technical formation occurs when the price fluctuations of an asset are confined within converging trendlines, creating a triangle-like shape on the chart. Traders interpret this pattern as a period of consolidation, often preceding a substantial price movement.
Key Points:
- Cardano’s price is forming a triangle pattern on the charts
- The triangle pattern suggests a period of consolidation
- A breakout from the pattern could lead to a significant price movement
- The prevailing trend supports a likely price ascent
- A retreat below the pattern’s support trendline may trigger a downturn
At present, Cardano’s price stands at $0.265, with modest gains of 1.2% over the past 24 hours and a 3.0% increase in value over the last week. However, the current triangle pattern indicates the potential for a more significant movement. Cardano reached its all-time high price of $3.09 on Sept. 2, 2021, and there is a consistent need for increased demand to align with its historical price levels.
Analysts speculate that the current ADA price could present an opportunity for investors to secure substantial gains if the layer-1 blockchain manages to match its previous demand. Traders remain cautious, aware that a breach below the pattern’s support trendline could lead to a notable downward movement.
Hot Take:
The triangle pattern forming in Cardano’s price charts suggests an imminent breakout that could lead to a significant shift in its trajectory. While the prevailing trend supports a likely price ascent, there is also the possibility of a downturn if the pattern’s support trendline is breached. With Cardano’s historical price levels in mind, investors should closely monitor the breakout to make informed decisions.


 By
By
 By
By
 By
By

 By
By