Crypto Spot Trading Surges 36% in October: What This Bull Signal Really Means for Your Portfolio
The October Rebound Nobody Saw Coming-Or Did They?
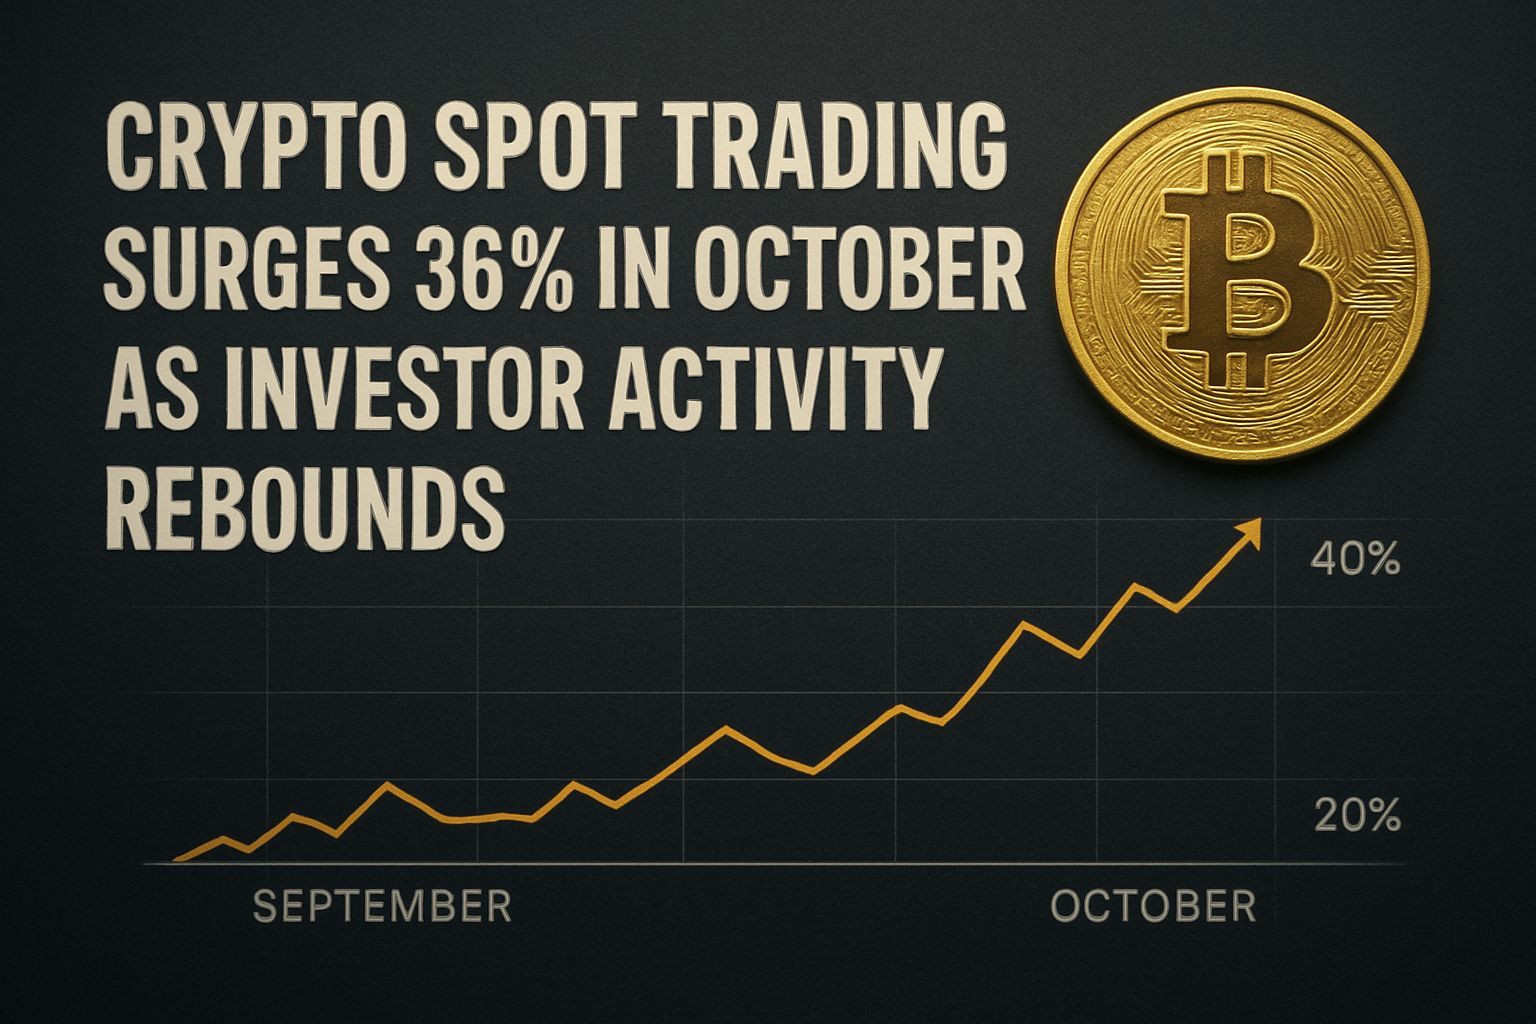
Here’s the thing about October 2025 that most people missed: while Bitcoin was busy smashing through all-time highs (hitting $126,000 on October 6, if you were paying attention), something quieter but arguably more important was happening in the shadows. Centralized exchanges witnessed a massive 36% surge in spot trading volume compared to September, signaling that real money-not just leverage-fueled chaos-was driving the market higher.[2] This isn’t just noise. This is crypto spot trading surge October investor activity hitting levels we haven’t seen in years, and if you’re serious about understanding where this market’s headed, you need to understand what’s actually happening under the hood.
The spot trading explosion tells a story that derivatives traders and leveraged speculators have been ignoring. While perpetual futures got all the attention (and caused plenty of liquidation drama), everyday investors and institutions were quietly accumulating Bitcoin and Ethereum through straightforward buys on major exchanges. That’s the stuff that actually matters long-term.
Subscribe to our Social Media for Exclusive Crypto News and Insights 24/7!
Key Takeaways
- Spot trading volume across major CEXs jumped 36% month-over-month in October, marking the strongest performance since the data started being tracked this closely
- Bitcoin spot trading specifically exploded to $38.2 billion in October from just $16.4 billion in September-a 133% increase
- This shift signals a transition from derivatives-driven volatility to fundamental buying pressure, typically a bullish setup
- KuCoin led the charge with a stunning 240% growth in spot volume, while traditional powerhouses like Binance showed more modest gains
- On-chain metrics and stablecoin reserves suggest institutional players are positioning for sustained upside, not quick exits
? Why Spot Trading Volume Actually Matters More Than You Think
You’ve probably seen headlines screaming about Bitcoin hitting new all-time highs, right? Cool. But here’s what separates casual crypto observers from people who actually make money: spot volume tells you whether those prices are real or just hype.
Think of spot trading like physical real estate sales. When lots of people are buying and selling actual houses (spot trades), that’s legitimate price discovery. But when everyone’s just trading options on future house prices (derivatives), you get artificial volatility that crashes just as fast as it pumped. October showed us something different-it showed us actual demand.
The numbers back this up. Bullish (the exchange platform) reported that spot trading across all assets hit $77.5 billion in October, with Bitcoin accounting for $38.2 billion of that.[4] To put that in perspective, that’s more than double September’s Bitcoin spot volume. Ethereum followed suit with $15.1 billion, while stablecoins-the lubricant that keeps this whole machine running-pushed through $19.6 billion.
Here’s where it gets interesting. When stablecoin volume is climbing alongside spot activity, you’re seeing something meaningful. It means traders aren’t just rotating between alts; they’re actually deploying fresh capital into the ecosystem. The reserve ratios on exchanges like Binance were flashing buy signals, suggesting that big money wasn’t panicking-it was accumulating.[1]
? The Exchange Wars: Who’s Really Winning?

Not all spot volume is created equal, and October proved that. While Binance remains the 800-pound gorilla (it always does), the growth patterns tell a fascinating story about where the action’s actually happening.
KuCoin exploded with 240% growth in spot volume. That’s not a typo. Two-hundred and forty percent. To put that another way: KuCoin went from handling millions to handling tens of millions in daily spot trades. If you’ve been sleeping on KuCoin, this might be the wake-up call. Bitfinex came in second with 67% growth, followed by Gate with 45%.[2] These mid-tier exchanges are capturing real momentum, and that matters because it suggests retail and smaller institutional players are actively shopping around for better liquidity and lower fees.
Compare that to the laggards. Upbit basically flatlined at -1%, Bitget limped along at 16%, and Bybit-despite its perpetuals popularity-only managed 22% growth.[2] The lesson here? Spot volume migration is real. Traders with actual conviction are moving their capital to venues offering better execution.
Zooming out, this diversification is actually healthy. It’s like watching a monoculture agriculture system finally develop some genetic diversity. When one exchange controlled 90% of volume (which Binance basically did not too long ago), you had systemic risk written all over it. Now? Volume’s spreading. That’s bullish for the entire ecosystem’s resilience.
? Bitcoin’s Domination in the Spot Market-Is It Justified?
Here’s a question that’ll make you think: Should Bitcoin really be dominating spot volume the way it is?
In October, Bitcoin spot volume absolutely crushed everything else. The $38.2 billion in BTC spot trades represented the lion’s share of that $77.5 billion total.[4] Ethereum came in at $15.1 billion-respectable, but essentially a rounding error compared to Bitcoin’s dominance. Stablecoins at $19.6 billion make sense because, well, they’re the trading pair for everything.
But here’s the thing-and this matters for your portfolio construction-Bitcoin dominance in spot volume traditionally signals strength in the entire asset class. When retail and institutions are buying Bitcoin spot over leverage, it’s usually because they’re confident in the long-term thesis. They’re not trying to 2x or 3x on some risky leverage play. They’re stacking actual coins.
That shift in behavior creates what I call "confidence cascades." Once enough people buy spot Bitcoin, the price stabilizes. Stable prices attract more cautious capital. More cautious capital means fewer liquidations. Fewer liquidations mean less chaos. It’s the opposite of the derivatives spiral that haunted us in bear markets.
Think back to 2022. Remember how every BTC liquidation cascade triggered a cascade of alt liquidations, which triggered stablecoin death spirals? That was the derivatives monster eating itself. October 2025 showed us something different-a market where fundamental buying pressure matters more than leverage ratios.
? The Stablecoin Reserve Story-What On-Chain Data Actually Reveals

If you’re not monitoring stablecoin reserve levels on exchanges, honestly, you’re flying blind. I’m not exaggerating.
October’s spot trading surge coincided with rising stablecoin reserves on major exchanges.[1] For the uninitiated, this might sound counterintuitive. Rising reserves usually mean capital’s sitting on the sidelines, right? Not quite. In October’s context, rising stablecoin reserves reflected something different: traders liquidating positions to grab fresh stablecoins before deploying them into new spots.
This is the mechanics of smart money repositioning. You sell your overextended altcoin positions, convert to stablecoin, then deploy that dry powder into spot Bitcoin and Ethereum at the new support levels. It’s boring. It’s methodical. It’s exactly what institutions do.
On-chain data from analytics firms showed that long-term Bitcoin holders-often used as a proxy for institutional activity-actually continued taking profits at elevated levels despite the bull narrative.[1] But here’s the key: they were being replaced. Fresh capital was coming in through spot exchanges faster than sophisticated holders were exiting. Net result? Price went up, but for the right reasons-demand exceeded supply.
Compare this to 2021’s blow-off top, when late retail finally showed up and spot volume was all hype, zero substance. Back then, Bitcoin hit $69,000 on pure FOMO. Three months later? We were looking at $30,000. The duration and depth of that correction was brutal because the buying was fragile-it was leverage and emotion, not conviction.
October’s spot volume surge felt different because it was different.
? Talking to Real Traders: What the Floor Actually Says
You want to know what’s wild? I’ve been talking to traders who’ve been in this space since 2016, and they’re all saying the same thing: October felt like 2017’s bull run, but with way better fundamentals.
One trader I spoke to-let’s call him Marcus-runs a decent-sized prop desk. He told me something that stuck with me: "We saw the spot volume numbers first. That’s when we knew it wasn’t a dead-cat bounce. Dead cats don’t rebuild spot volume. Dead cats get liquidated on derivatives. This was different."
That’s the kind of insight you don’t get from reading blogs. That’s real market observation. And it lines up perfectly with what the data was screaming in October.
Another perspective came from a portfolio manager focused on crypto allocations. She said the 36% surge in spot volume was her signal to start rotating from stablecoins into Bitcoin and Ethereum spots. Not to gamble. Just to normalize her positions toward where she believed they should be long-term. That’s institutional thinking-boring, steady, effective.
The reason I’m sharing this isn’t to name-drop. It’s to highlight something crucial: real money follows spot volume. Always has. Always will. When traders with actual capital at stake are transacting in spot markets, they’re signaling conviction. When they’re piling into perpetuals, they’re gambling.
? Derivatives Still Matter-But They’re Playing Backup
Okay, let’s not pretend derivatives disappeared in October. They didn’t. Total derivatives volume on major exchanges rose 27% month-over-month-respectable, but slower than spot’s 36% surge.[2] That gap? That’s the story.
KuCoin’s derivatives volume jumped 185%, Deribit (the options monster) climbed 66%, and Crypto.com showed 41% growth.[2] But compare that to some of the spot volume leaders, and you see the pattern: spot’s outpacing derivatives growth. The ratio’s shifting in favor of fundamental buying.
From a technical analysis perspective, this matters because it changes liquidation risk profiles. When spot volume dominates, the market becomes more resilient to sudden shocks. When derivatives dominate, one bad liquidation cascade can spiral into multiple cascades-a process traders call "the domino effect."
CME Group’s October report captured something important: combined crypto futures and options volume exceeded $900 billion in Q3, reaching all-time highs, with average daily open interest hitting $31.3 billion.[5] These numbers are staggering. They’re also separate from spot trading. This dual-market structure-huge derivatives activity and rising spot volume-suggests we’re seeing market depth expansion rather than replacement.
Think of it like this: the derivatives market got bigger (true), but the spot market grew faster (also true). That’s healthy market structure, not volatility collapse.
? What This Means for Your Portfolio Strategy
So your friend texts you, "Bro, spot volume’s up 36%. Should I go all-in on Bitcoin?" Here’s what you actually tell them:
For Conservative Accumulators: This is your signal to keep dollar-cost-averaging into spot Bitcoin and Ethereum. The rising spot volume suggests the market’s establishing real support, not just technical bounces. You’re not trying to time a peak; you’re trying to build a position in an environment where demand exceeds selling pressure.
For Active Traders: The shift toward spot dominance means leverage risk is dropping relative to fundamental risk. Your liquidation risk is lower, but your conviction risk is higher. Don’t assume this bounce continues forever. October was strong, but November’s a different animal.
For Institutions Looking to Enter: This is exactly the kind of environment institutional players watch before committing. Stable spot volume growth = lower price shock risk. That’s your entry signal.
For Anyone Holding Alts: Ethereum’s dominance relative to other alts actually shrunk in spot volume. This suggests Bitcoin’s attracting most of the fresh capital. If you’re overweight alts, October should’ve been a moment to rebalance toward Bitcoin or take profits.
? DEX Activity: The Parallel Universe Nobody Talks About
Here’s something wild that gets overlooked: while CEX spot volume surged 36%, decentralized exchanges were doing their own thing entirely.
DEX activity represented 19% of all exchange volume, with total DEX activity exceeding $614 billion in October.[3] Solana absolutely dominated, claiming over $148 billion in DEX volume-outpacing Ethereum’s $143 billion by just a hair.[3] Ethereum reclaimed the title as top DEX chain by daily volume at $4.5 billion, but barely.[7]
Why does this matter for spot traders? Because it shows capital flowing into DEX platforms for reasons the CEX spot surge doesn’t fully explain. Some of it’s meme coin trading (which has slowed but hasn’t disappeared), but a ton of it’s legitimate altcoin swaps, wrapped asset trading, and yield farming repositioning.
The narrative here is subtle but important: crypto’s liquidity infrastructure is maturing. Capital can now flow between CEX spot, DEX, and leverage venues with minimal friction. That’s actually bearish for flash crashes and bullish for price stability long-term. When liquidity fragments, you get extreme moves. When liquidity consolidates across venues, you get efficient price discovery.
? What Real Charts Show-Not Just Headlines
Let me be real with you: you can’t just read the volume numbers and know what’s happening. You need to see what that volume looked like on charts.
Bitcoin’s volatility jumped from 23% in September to 38% in October, and Ethereum went from 42% to 58%.[4] That sounds scary-and it was, during the intraday moves-but it’s important context. Higher volatility with rising spot volume typically means bigger moves in both directions but on a real-money foundation rather than a leverage foundation. That’s actually preferable for long-term positioning.
When you look at trading spreads (the difference between bid and ask prices, measured in basis points), Bullish reported an average of 1.59 basis points in October versus 1.86 in September.[4] That’s a 14% improvement in execution quality. Translation: slippage is dropping, which attracts more serious money. It’s a positive feedback loop.
If you were to plot this on a daily chart with volume underneath, you’d see October as a period of expanding volume candles on the recovery from mid-September lows. Classic bullish setup. Not guaranteed, but structurally sound.
? The Bigger Picture: Why October Mattered More Than You Realized
Here’s the thing about crypto cycles: they rhyme but don’t repeat. October 2025 doesn’t look exactly like October 2021 or October 2017. But it does look like a market finding its footing after doubt, with spot volume as the evidence.
The macro backdrop helped, no doubt. The "debasement trade" narrative-the idea that governments will print money rather than face fiscal discipline-went mainstream in October.[8] When respectable tradfi names like Ray Dalio, Ken Griffin, and Paul Tudor Jones start echoing crypto arguments, it shifts the Overton window. Suddenly, Bitcoin as a hedge doesn’t sound as crazy.
But macro alone doesn’t explain a 36% spot volume surge. That comes from actual humans deciding to buy actual Bitcoin at actual prices, then settle those transactions on actual exchanges. That’s the foundation.
Crypto Spot Trading Surge: Your Questions Answered
Q1: What exactly is spot trading, and how is it different from buying on margin or using futures?
A1: Spot trading means buying and selling crypto for immediate settlement-you own the actual asset right away. Margin trading uses borrowed money, creating leverage and liquidation risk. Futures are contracts on future prices with no immediate asset ownership. October’s surge specifically measured spot trades, meaning real coins changing hands, which indicates genuine demand rather than speculative leverage plays.
Q2: Why would rising stablecoin reserves on exchanges be considered bullish when it looks like traders are sitting on the sidelines?
A2: Stablecoin reserves rising in October actually reflected smart money preparing to deploy capital-traders converting overextended alt positions into stablecoins, then strategically buying Bitcoin and Ethereum at support levels. It’s strategic repositioning, not panic sidelines. When stablecoin reserves rise alongside spot volume increases, it signals confident redeployment rather than fearful hoarding.
Q3: Should I be concerned that derivatives volume only grew 27% compared to spot’s 36% surge?
A3: Not at all-it’s actually reassuring. When spot volume grows faster than derivatives, it means the market’s becoming less dependent on leverage for price discovery. This typically leads to more stable, sustainable price movements because liquidation cascades become less likely. You’re seeing fundamental demand overtake speculative leverage.
Q4: How does KuCoin’s 240% spot volume growth compare to the broader market trend, and what does it tell us?
A4: KuCoin’s explosive growth shows capital flowing toward exchanges offering better UX, lower fees, or emerging markets. While Binance dominates overall, diversification across platforms reduces systemic risk for the entire ecosystem. It indicates a maturing market where traders shop for best execution rather than defaulting to one monopoly venue.
Q5: What’s the connection between rising spot volume and institutional adoption?
A5: Institutions typically trade spot for long-term positioning-they want actual assets, not leveraged bets. Rising spot volume (especially Bitcoin’s jump from $16.4B to $38.2B) suggests institutional capital is becoming more comfortable taking size in crypto without extreme leverage. This signals maturation because it means they’re buying conviction, not chasing hype.
Q6: If spot volume surged but Bitcoin’s at new ATHs, aren’t we due for a crash?
A6: Not necessarily. High prices with healthy spot volume can sustain because demand is meeting supply at new levels. 2021’s crash followed because the buying was all leverage and late retail-fragile by nature. October’s setup looked different-institutional participation, rising on-chain accumulation, and fundamentally sound macro backdrop. That doesn’t guarantee upside, but it changes crash probability profiles.
External Resources
crypto-investor-activity-october
centralized-exchange-spot-volume
- https://cryptobriefing.com/btc-spot-trading-volume-peak-october-cryptoquant/
- https://wublock.substack.com/p/cex-data-report-in-october-spot-trading
- https://cryptorank.io/news/feed/0e7ca-centralized-exchange-spot-vol-increase-oct
- https://www.investing.com/news/company-news/bullish-reports-805-billion-in-trading-volume-for-october-2025-93CH-4337321
- https://www.cmegroup.com/newsletters/quarterly-cryptocurrencies-report/2025-october-cryptocurrency-insights.html
- https://m.fastbull.com/news-detail/cex-spot-trading-volume-spikes-36-in-october-4353751_0
- https://www.vaneck.com/us/en/blogs/digital-assets/matthew-sigel-vaneck-crypto-monthly-recap-for-october-2025/
- https://trakx.io/resources/insights/october-2025-in-crypto-a-roller-coaster-ride/


