The Dogecoin (DOGE) price breaks below 120-day support area
Even though the DOGE price has broken down from a 120-day horizontal support area on October 9, it is still trading within a longer-term horizontal support level.
Dogecoin falls below 120-day support area
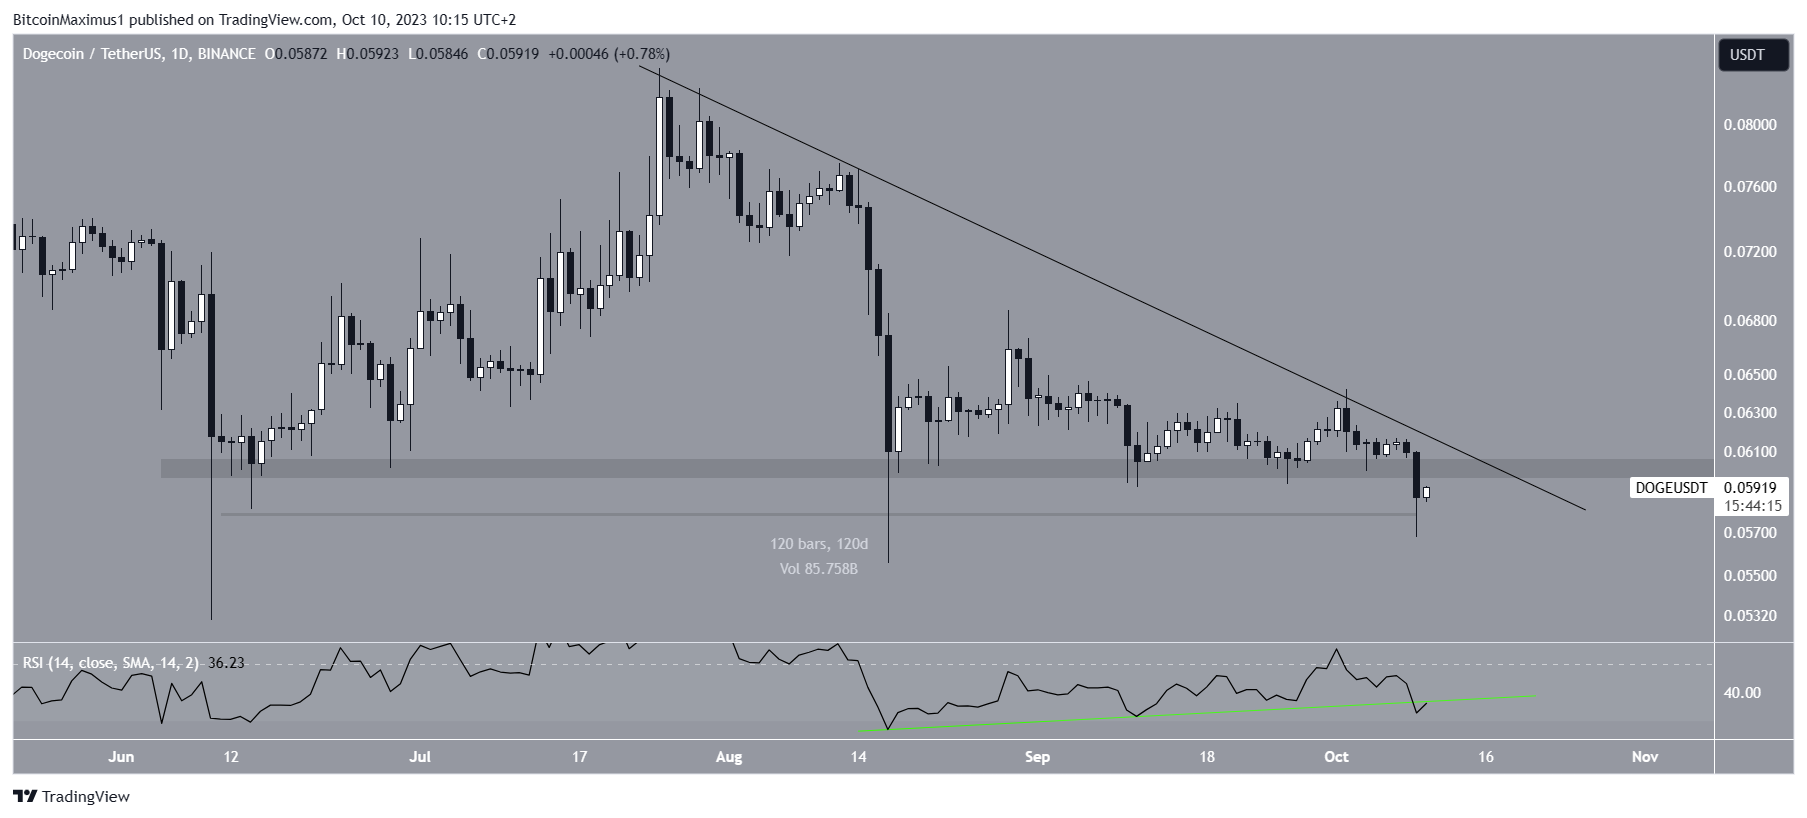
On the daily timeframe, the technical analysis reveals that DOGE has been trading above the $0.060 horizontal support area since June 10. Additionally, it has been under a descending resistance trendline since July 25, forming a descending triangle pattern, which is considered bearish.
The recent volatility in Dogecoin caused a breakdown from the support area, resulting in a low of $0.057, the lowest price since August 17. The price has slightly bounced back but has not reached the $0.060 area yet.

The daily Relative Strength Index (RSI) is bearish, indicating a downward trend. The RSI reading is below 50 and falling, signaling a bearish trend. Moreover, it broke down from its bullish divergence trendline.
DOGE price prediction: Where to next after breakdown?
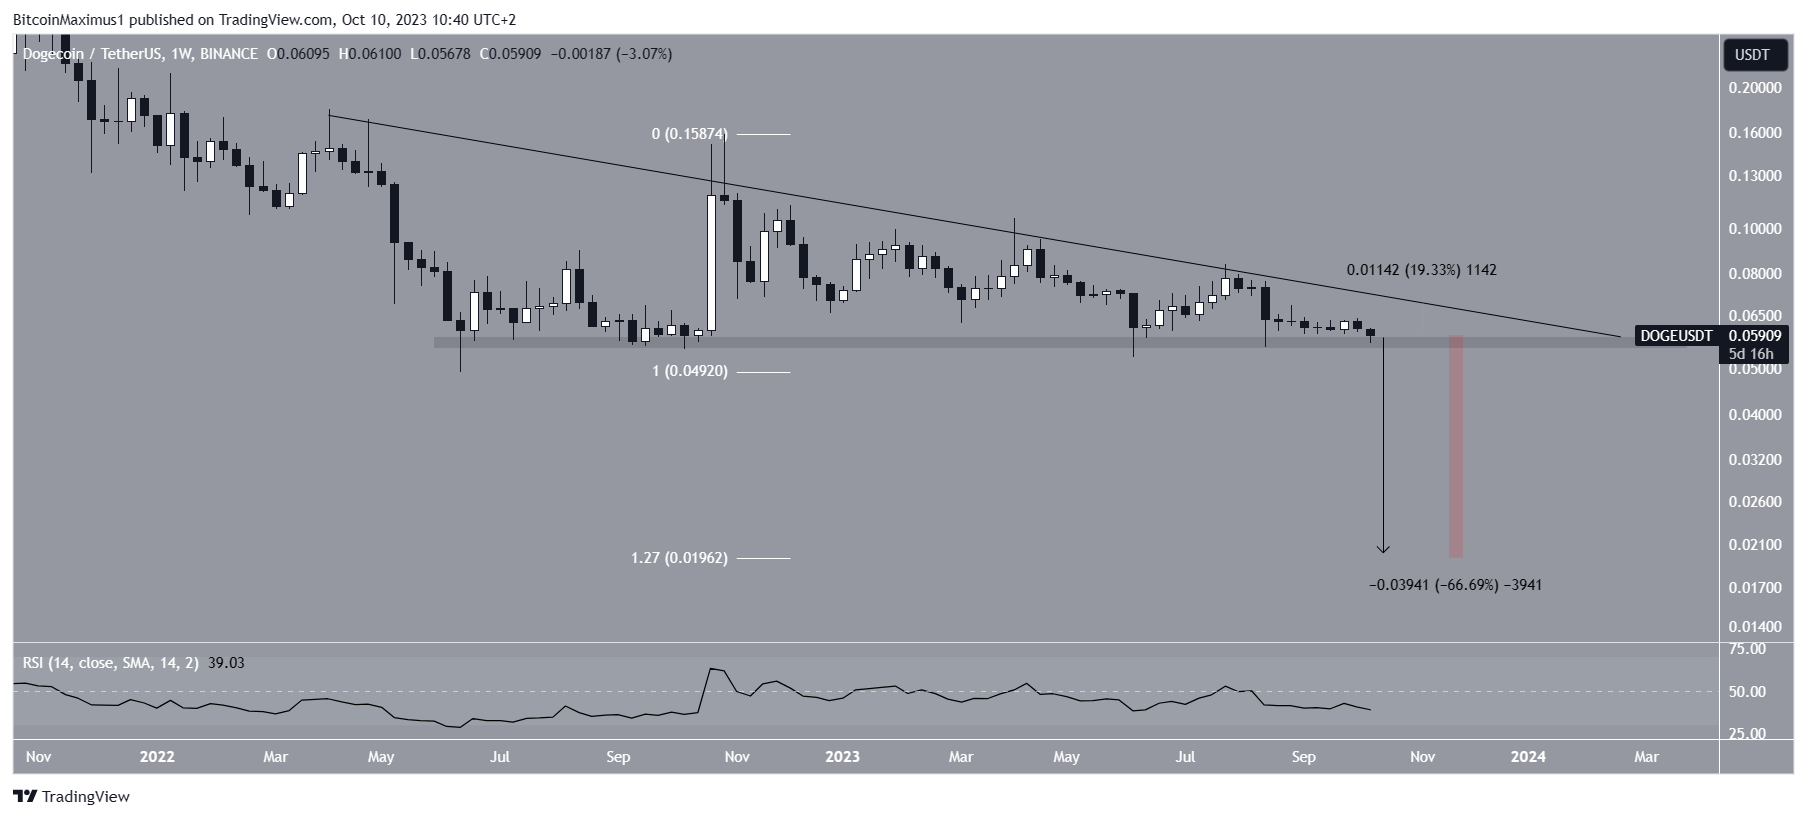
Looking at the weekly timeframe, there are two reasons for a bearish outlook. Firstly, DOGE is trading within a larger descending triangle pattern with a base at $0.057. A breakdown that reaches the entire height of the triangle would take DOGE to $0.020, a 67% decrease from the current price.
The 1.27 Fib extension also supports this area as a potential bottom since it falls at $0.020. Fibonacci retracement levels theory suggests that after a significant price change in one direction, the price is likely to partially return to a previous level before continuing in the same direction.

Despite the bearish prediction, if DOGE experiences a strong bounce at the long-term horizontal support area of $0.057, it could lead to a 20% increase towards the long-term descending resistance trendline, currently at $0.070.
Hot Take: Dogecoin faces bearish outlook as it falls below support
Dogecoin’s recent breakdown from the 120-day support area and the formation of a descending triangle pattern indicate a bearish trend. The daily and weekly RSI readings are below 50 and falling, further supporting the bearish outlook. However, if DOGE manages to bounce back from the long-term support area, there is a possibility of a short-term bullish move towards the descending resistance trendline. Traders and investors should closely monitor the price action and key support levels to make informed decisions.


 By
By
 By
By
 By
By


 By
By