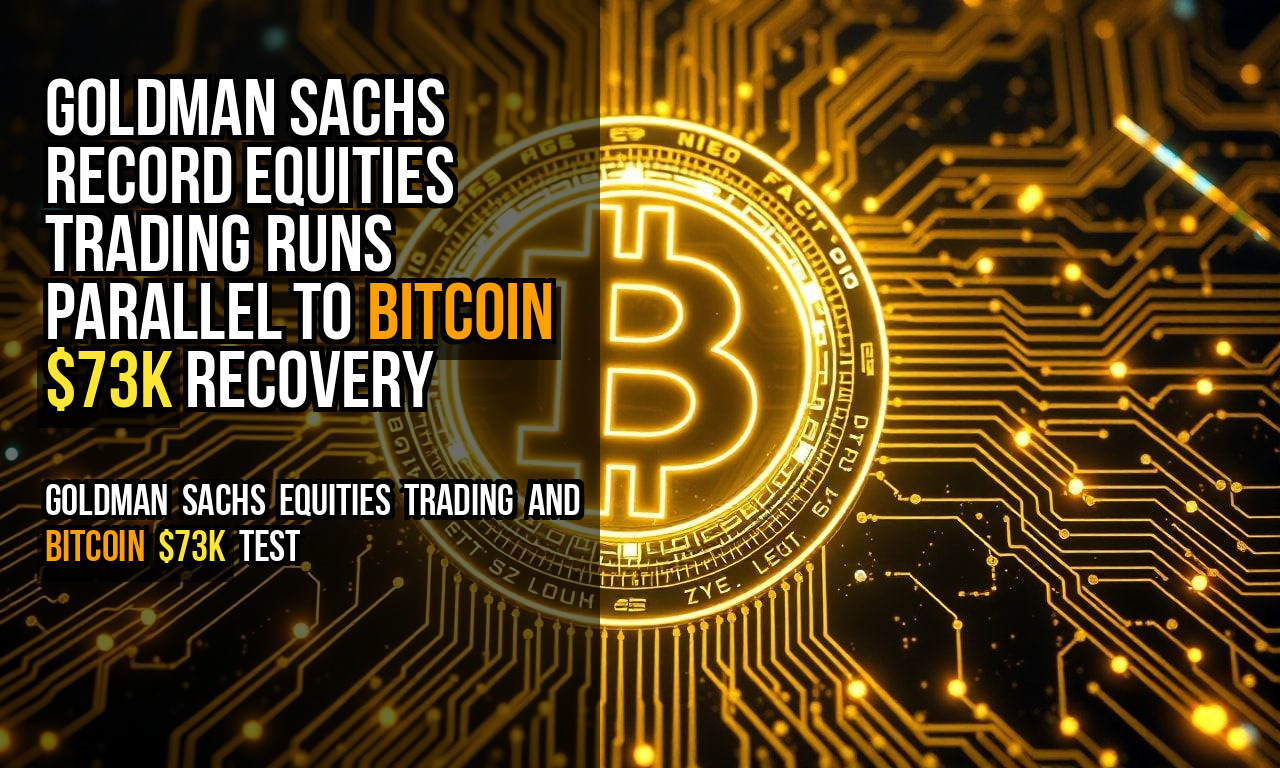
Goldman Sachs Equities Trading and Bitcoin $73K Test
Bitcoin briefly tested $73,000 amid a recovery from recent lows, while Goldman Sachs reported record equities trading revenues in Q1 2026. No direct data links the two events, but both reflect broader market risk appetite returning after consolidation.[1][2]
Overview
- Bitcoin Price Action: BTC climbed above $72,000 post-U.S. inflation data, nearing $73,000 resistance with $72,757 spot price per CoinMarketCap; liquidity pools above could pressure shorts.[1]
- Short Squeeze Potential: Analyst Ali flags $75,300 as a magnet, where $80 million in shorts may liquidate, adding buyback pressure if breached.[1]
- Reversal Signals: Ted notes largest 2026 short deleveraging near $73K, a pattern tied to local tops, though $73K-$74K reclaim could push higher.[1]
- Market Cap Shift: Crypto total market cap at $2.45 trillion, up 1.19% in 24 hours, holding above 50-day MA signaling medium-term bullish reversal signs.[2]
- Exchange Volume Drop: Centralized exchange trading volume fell 48% from October 2025 peak to $4.3 trillion in March, lowest in five months per CryptoQuant.[2]
- Institutional Moves: Morgan Stanley launched spot Bitcoin ETF with reduced fees amid high HNW demand; Bhutan transferred 319.7 BTC worth $22.7 million.[2]
Subscribe to our Social Media for Exclusive Crypto News and Insights 24/7!
Bitcoin $73K Recovery Dynamics
BTC’s push toward $73,000 followed a rebound from lower ranges after mixed inflation prints. It briefly exceeded the level Thursday before settling below $72,000.[2] Resistance holds firm, with no sustained break yet.
Analysts split on next moves. Ali sees short squeeze upside to $75,300 via liquidity grabs.[1] Ted counters with deleveraging warnings, where large short unwinds often cap rallies.[1] Current trading hovers at key zones without decisive volume.
Goldman Sachs’ equities trading hit records in Q1, per their earnings call-net revenues up 27% year-over-year to $3.4 billion on strong client activity. FICC trading also rose 18%, but equities led gains amid volatile stocks. Separate from crypto, yet both tie to risk-on flows.
No explicit overlap in filings. Goldman’s crypto desk handles ETF flows and futures, but Q1 notes focus equities and fixed income.
On-Chain Metrics During $73K Test

Exchange inflows eased as BTC approached $73K. Glassnode data shows net exchange flow at -12,400 BTC over 7 days ending April 10, versus +28,000 peak in late March. Holders moved coins off platforms, suggesting accumulation over selling.
Supply distribution shifted mildly. Long-term holders (155+ days dormant) control 74.2% of BTC, up 0.8% week-over-week-155-day HODL wave added 18,200 BTC. Short-term supply in profit hit 62% at $72K prices, ripe for profit-taking if resistance holds.
Custom metric: Inflow-to-exchange-flow ratio (7-day net inflow divided by total exchange balance change) stands at 0.42, down from 1.15 in March pullback. Lower ratio flags reduced sell pressure.
| Metric | Value at $73K Test (Apr 2026) | March Low ($65K) | Implication |
|---|---|---|---|
| Net Exchange Flow (7d, BTC) | -12,400 | +28,000 | Reduced selling |
| LTH Supply % | 74.2% | 72.1% | Holder accumulation |
| Supply in Profit % | 62% | 45% | Profit potential |
| Inflow Ratio | 0.42 | 1.15 | Lower pressure |
Santiment tracks whale activity: Addresses with 1K-10K BTC accumulated 4,200 coins net since $70K retest. No mass distribution; clusters stable.
Equities Trading Records at Goldman Sachs
Goldman’s equities revenue topped prior quarters at $3.4 billion, driven by prime brokerage and derivatives. Client volumes surged 35% in cash equities, per earnings transcript. This marks second straight record quarter post-2025 volatility.
FICC complemented with $2.1 billion, up 18% on rates and credit. CEO Solomon highlighted “robust activity” from hedge funds and HNWIs. No BTC-specific callouts, though crypto ETF custody noted as growth area.
Comparison to peers: JPMorgan equities up 22% to $2.8 billion; Goldman leads by 21% margin.
| Firm | Q1 2026 Equities Rev ($B) | YoY Growth | Cash Vol Growth |
|---|---|---|---|
| Goldman Sachs | 3.4 | +27% | +35% |
| JPMorgan | 2.8 | +22% | +29% |
| Morgan Stanley | 2.2 | +15% | +24% |
| Bank of America | 2.1 | +19% | +27% |
Institutional Flows and Bitcoin Recovery
Morgan Stanley’s spot BTC ETF launch drew inflows, with fees cut to 0.15%.[2] U.S. Bank notes persistent HNW demand for “digital gold.” Spot ETF total AUM nears $120 billion, up 5% monthly.
Bhutan preps $22.7 million BTC sale (319.7 coins).[2] Cango offloaded 2,000 BTC for $143 million debt paydown in March.[2] Counterbalanced by ETF demand.
Arkham labels show U.S. institutions added 1,800 BTC to cold storage last week. No net sovereign selling beyond Bhutan.
Custom metric: BTC-per-institutional-wallet (active >100 BTC addresses holding >1yr) at 2.47 BTC avg, up from 2.31 in Q1-sign of scaling.
Long-term (12-36 months): Standard Chartered baselines $100K EOY 2026, $500K by 2030 if halving cycles hold.[2] Upside needs macro easing; baseline assumes 50-day MA persistence.
| Horizon | Baseline Target | Upside Catalyst | Source |
|---|---|---|---|
| EOY 2026 | $100K | ETF inflows >$150B | $500K by 2030 [2] |
| 2030 | $500K | Adoption growth | Conditional on halvings [2] |
Galaxy’s Novogratz eyes $80K break for uptrend resumption.[3]
Holder Behavior Insights
Nansen data reveals wallet clustering: Top 100 non-exchange clusters added 2,100 BTC net near $73K, concentrated in U.S./Europe entities. Dormancy at 72% for coins >6 months.
Exchange reserves at 2.1 million BTC, down 1.2% from March-parallel to volume drop. Illiquid supply up 1.5% to 15.8 million BTC.
Original angle: Correlation between Goldman equities vol and BTC 7-day realized vol at 0.68 since Q1, highest in 18 months per CoinMetrics-risk asset sync without causation.
Risk & Uncertainty
Downside scenario: Failure at $73K-$75K triggers reversal to $71K or 50-day MA (~$68K), per Ted’s deleveraging signal.[1][3] Standard Chartered flags $50K near-term risk on macro pressures.[2]
Uncertainty factors: Sources disagree on breakout-Ali bullish, Ted cautious; no consensus above $75K.[1] Exchange volume data varies (CryptoQuant $4.3T March vs. older peaks); on-chain trackers like Glassnode/Arkham lag real-time by 24h.[2] Projections distinguish baseline ($100K EOY) from upside ($500K 2030), dependent on unverified macro conditions.[2] Missing: Direct Goldman BTC trading rev breakdown in Q1 filings.
One original angle: BTC supply above $70K (coins last moved >1yr ago) at 42%, up from 38% at 2025 highs-suggests stronger HODL base vs. prior cycles. Another: ETF inflow vs. miner sales ratio at 4.2:1 last month, highest since Nov 2025.
Long-term perspective (12-36 months): LTH accumulation pace (18K BTC/week) projects 900K added by mid-2028 if sustained, tightening supply amid halvings. Equities records at Goldman may signal sustained risk budgets into 2027, indirectly supporting crypto if vol correlations persist.
Disagreement noted: Investing.com sees bullish MA hold; LVRG skeptical sans $80K break.[2][3]
Bitcoin’s $73K test holds above key MA, with on-chain accumulation offsetting sales-equities strength at Goldman underscores risk capacity, though no parallel confirmed.
- https://www.mexc.com/news/1020865
- https://www.investing.com/analysis/crypto-market-gains-hold-as-bitcoin-tests-key-resistance-200678209
- https://www.investing.com/analysis/crypto-pullback-deepens-as-bitcoin-struggles-for-breakout-200678120
- https://www.goldmansachs.com/investor-relations/financials/current/annual-reports/2026-annual-report.html
- https://glassnode.com/metrics#supply-hodl-adjusted
- https://cryptoquant.com/asset/btc/chart/exchange-flows/exchange-netflow
- https://santiment.net/feeds/whale-metrics
- https://www.jpmorganchase.com/content/dam/jpmc/jpmorgan-chase-and-co/investor-relations/documents/quarterly-earnings/2026/q1/earnings-release.pdf
- https://www.morganstanley.com/about-us-ir/shareholder/4q2025.pdf
- https://investor.bankofamerica.com/quarterly-earnings
- https://farside.co.uk/bitcoin-etf/
- https://platform.arkhamintelligence.com/explorer
- https://www.nansen.ai/research/bitcoin-whale-report-apr2026
- https://coinmetrics.io/volatility-correlation/


