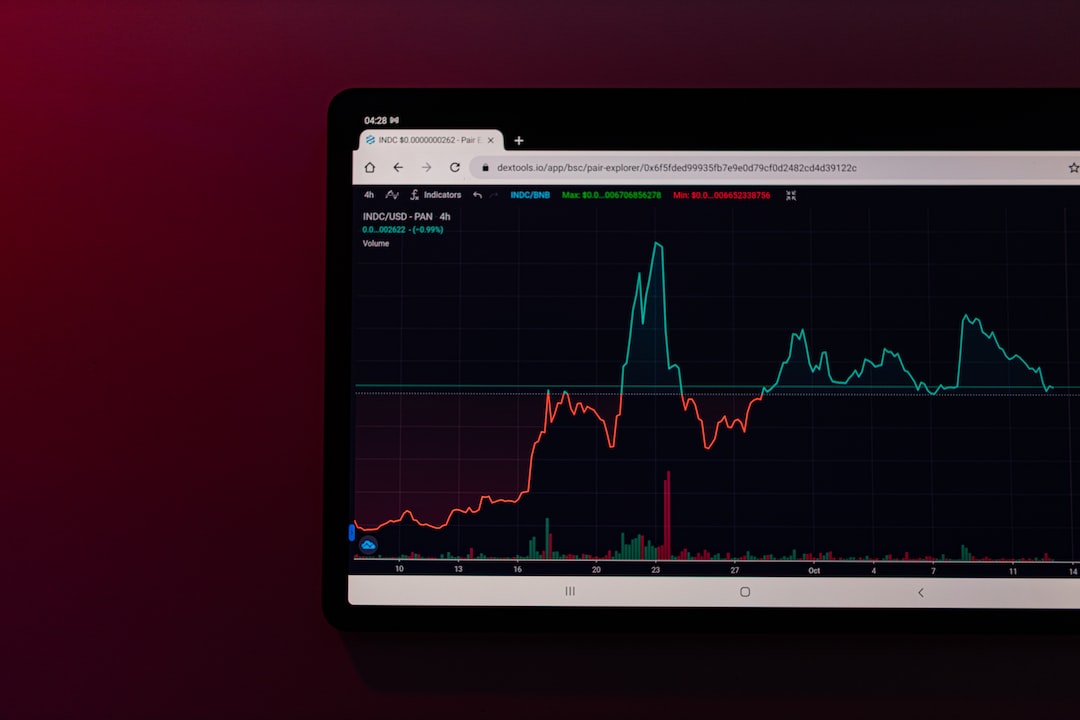
Ethereum Price Continues to Rise
The price of Ethereum has extended its upward movement and surpassed the $2,650 resistance level. It is currently trading above $2,550 and the 100-hourly Simple Moving Average. On the hourly chart of ETH/USD, there is a bullish trend line forming with support at $2,590.
Positive Zone Maintained
Ethereum has remained in a positive zone above the $2,500 resistance. Despite a correction in gains, the price tested the 23.6% Fib retracement level and is now trading above $2,550 and the 100-hourly Simple Moving Average.
Potential Upside Resistance
If there is another increase in price, Ethereum may face resistance near the $2,640 level. The next major resistance lies around $2,680. A clear move above this level could push ETH towards $2,720 and potentially into a bullish zone.
Downside Correction Possible
If Ethereum fails to break the $2,680 resistance, a downside correction may occur. The initial support lies at the $2,590 level and the bullish trend line. Further support can be found at the $2,465 zone or the 50% Fib retracement level.
Technical Indicators
The MACD for ETH/USD is losing momentum in the bullish zone, while the RSI is currently above 50.
Hot Take: Ethereum’s Price Surge May Continue
Ethereum’s price surge shows no signs of slowing down as it continues to surpass key resistance levels. With its positive momentum maintained and potential upside resistance levels ahead, there is a strong possibility that Ethereum’s price will continue to rise. However, a downside correction is also possible if it fails to break the current resistance. Traders should closely monitor the support levels and technical indicators to make informed decisions.


 By
By
 By
By
 By
By


 By
By