The Request (REQ) price surges and attempts breakout from long-term pattern
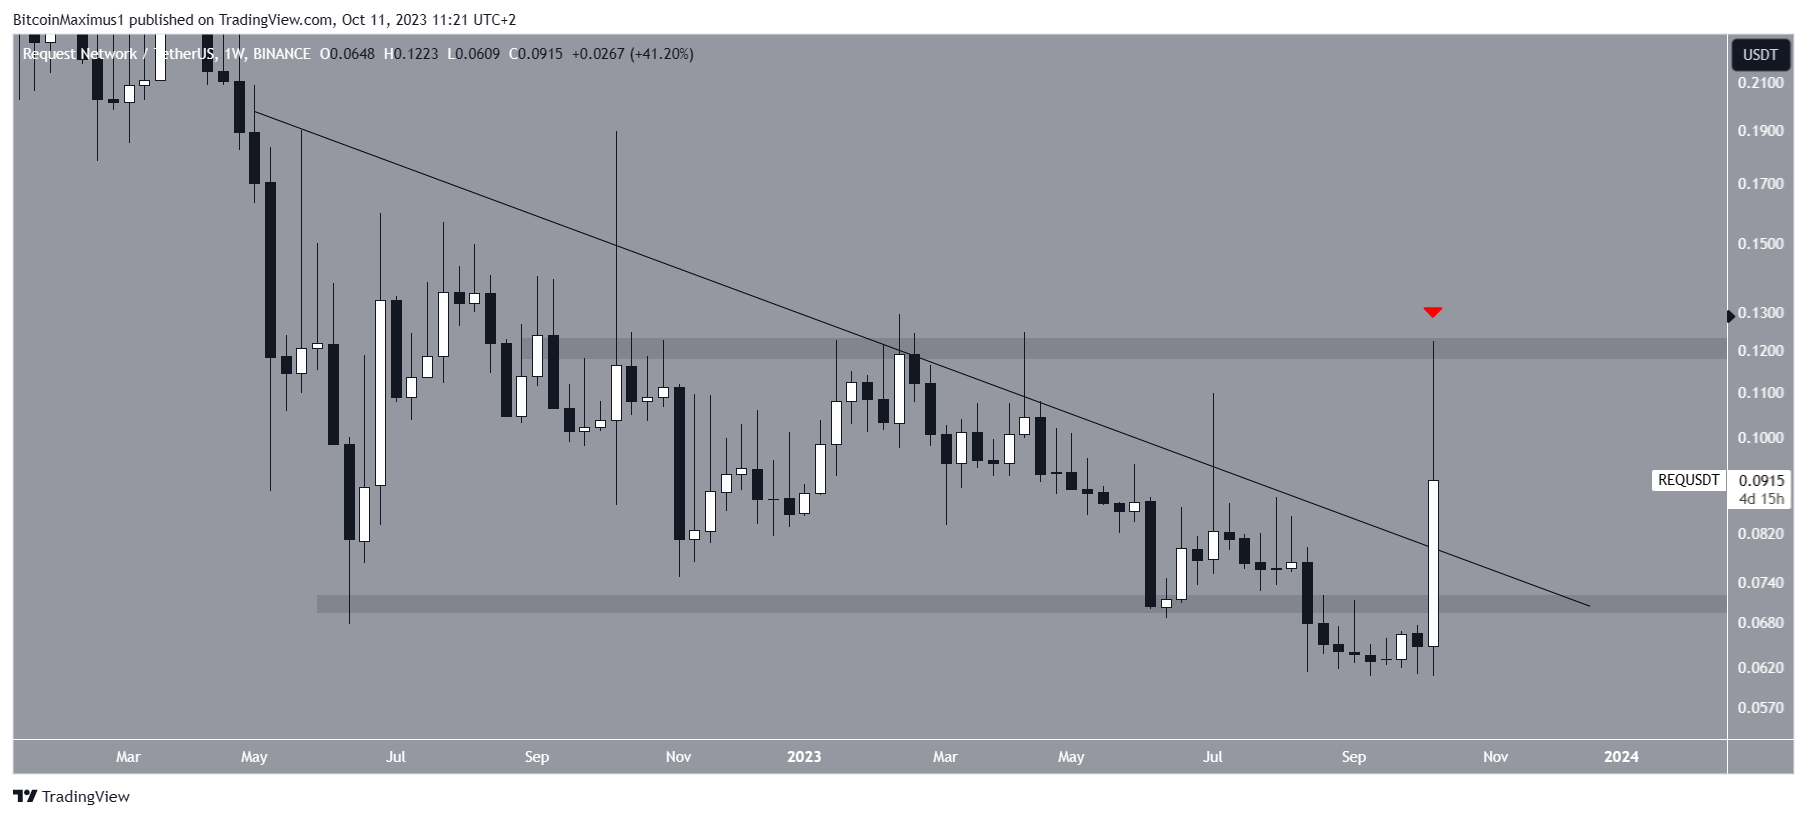
The price of Request (REQ) experienced an 80% increase on October 10, coming close to reaching a new yearly high the following day. This surge led to a breakout from a descending resistance trendline that had been in place since May 2022. Now, the question is whether the price can continue pushing towards a new high in 2023.
Overview of Request’s long-term pattern
Since May 2022, the REQ price has been following a descending resistance trendline. This downward movement resulted in a low of $0.061 in August. Additionally, this low caused a breakdown from the $0.070 horizontal support area that had been providing support since June 22.
However, despite this breakdown, Request quickly recovered and began an upward movement on October 10 with an impressive 80% increase.

Despite the initial surge, the cryptocurrency couldn’t sustain the increase and is currently forming a long upper wick in the weekly timeframe. This indicates selling pressure as sellers took over when buyers couldn’t maintain the upward momentum.
REQ Price Prediction: Potential for a new yearly high
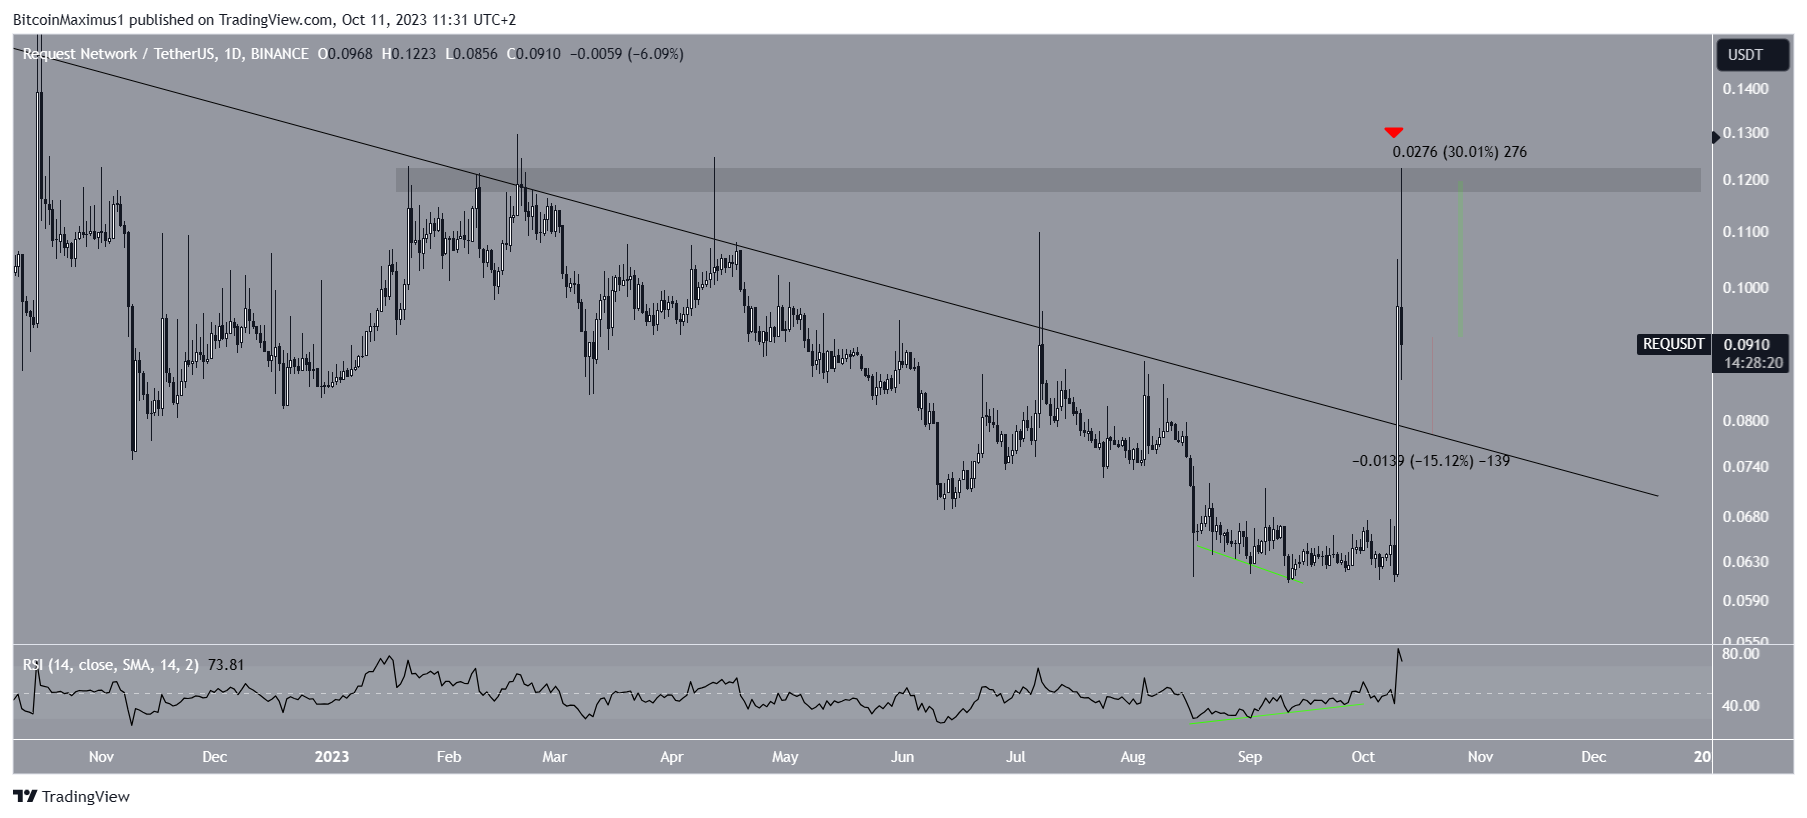
An analysis of the daily timeframe suggests a bullish outlook for Request’s price. One indicator supporting this prediction is the Relative Strength Index (RSI). Traders commonly use the RSI as a momentum indicator to determine market conditions and make decisions regarding asset accumulation or sale.
The RSI reading for REQ is currently above 50, indicating a bullish trend. Additionally, there was a bullish divergence in the RSI prior to the price increase, suggesting a potential trend reversal.
Furthermore, Request has closed above the descending resistance line on the daily timeframe, solidifying the breakout. However, in order to reach the $0.120 resistance area again, REQ would need to increase by an additional 30%.

Despite this bullish prediction, there is a possibility of a 15% drop if a bearish daily candlestick forms, potentially leading to a retest of the descending resistance trendline at $0.076.
Hot Take: Request (REQ) making strides towards a new yearly high
The recent surge in the price of Request (REQ) has brought it close to reaching a new yearly high. With a breakout from a long-term descending resistance trendline and bullish indicators such as the RSI, there is potential for REQ to continue its upward momentum. However, caution should be exercised as a bearish candlestick could lead to a retest of the resistance trendline. Keep an eye on REQ’s price movement as it aims for new heights in 2023.


 By
By
 By
By
 By
By
 By
By
 By
By
 By
By