The STORJ Price Faces Rejection from Range High
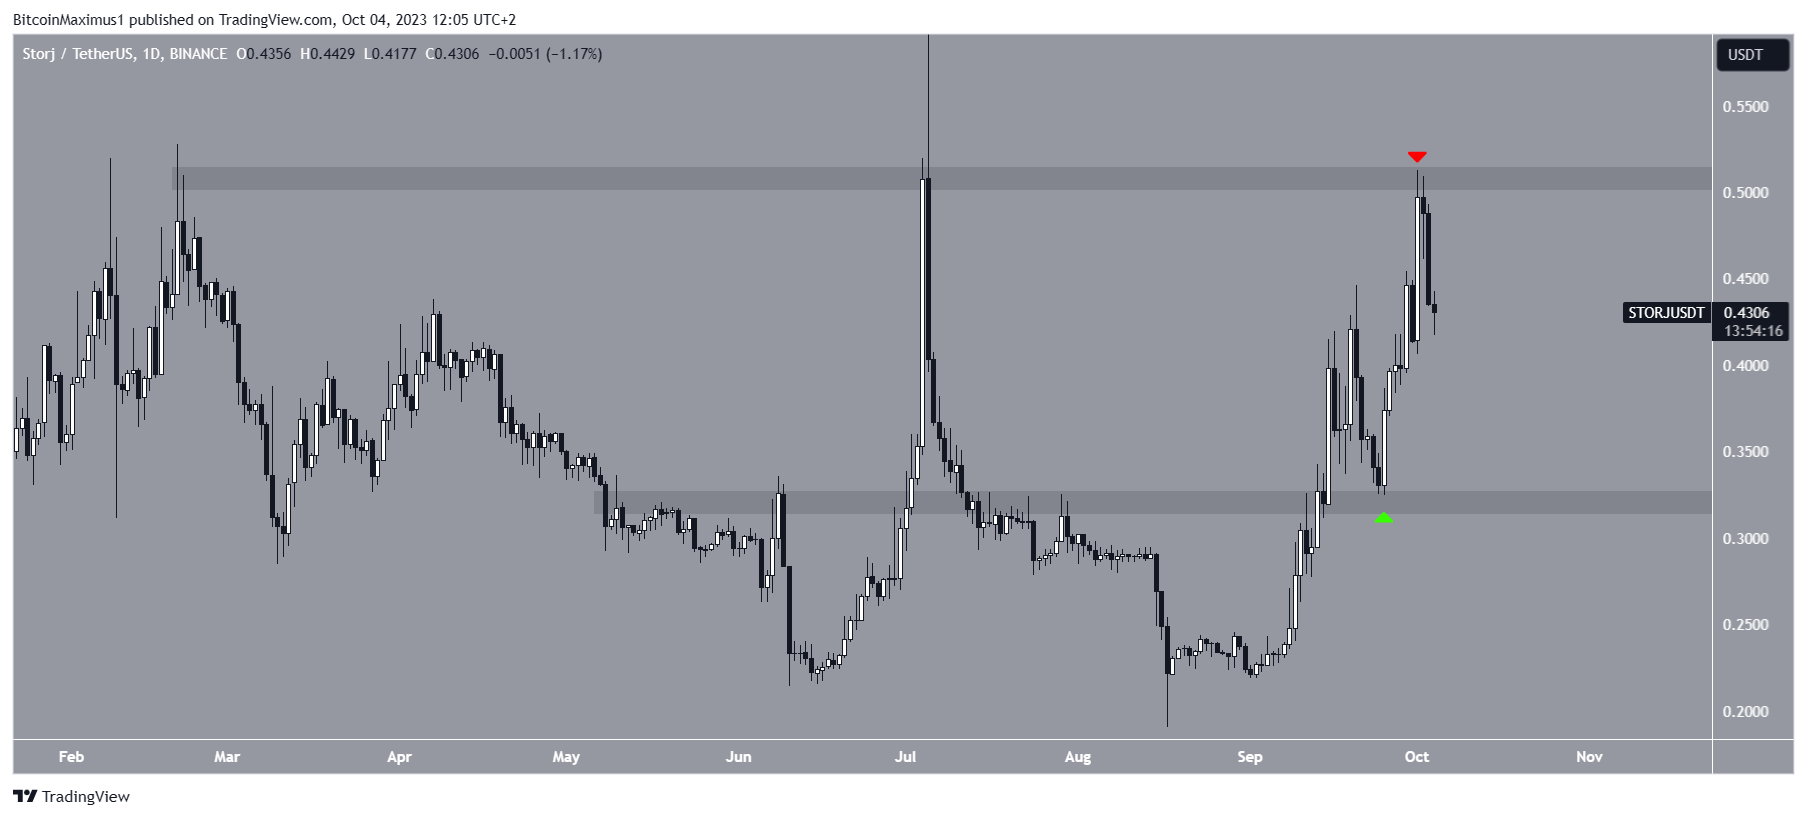
After experiencing a bullish September with a 90% increase, the STORJ price was recently rejected by its range high on October 1 and has since fallen significantly. This decline is not unique to STORJ but has been observed across the entire crypto market.
Breakout and Validation of Support
On September 14, STORJ broke out from the $0.32 horizontal resistance area. However, it later returned to validate this area as support ten days later, which is a common movement after breakouts.
Trading in a Horizontal Range
The increase in STORJ price culminated with a high of $0.51 on October 1, followed by an immediate decrease. This decline confirmed the $0.50 horizontal area as resistance. Based on the movement since September, it appears that the STORJ price is now trading in a horizontal range between $0.32 and $0.50.

Undetermined Trend Based on RSI
The daily Relative Strength Index (RSI) does not provide a clear confirmation of the trend’s direction for STORJ. The RSI is a momentum indicator used by traders to assess whether a market is overbought or oversold and to make decisions about accumulating or selling assets. With the RSI falling but still above 50, the mixed signs make it difficult to determine the trend.
STORJ Price Prediction: Retracement Expected
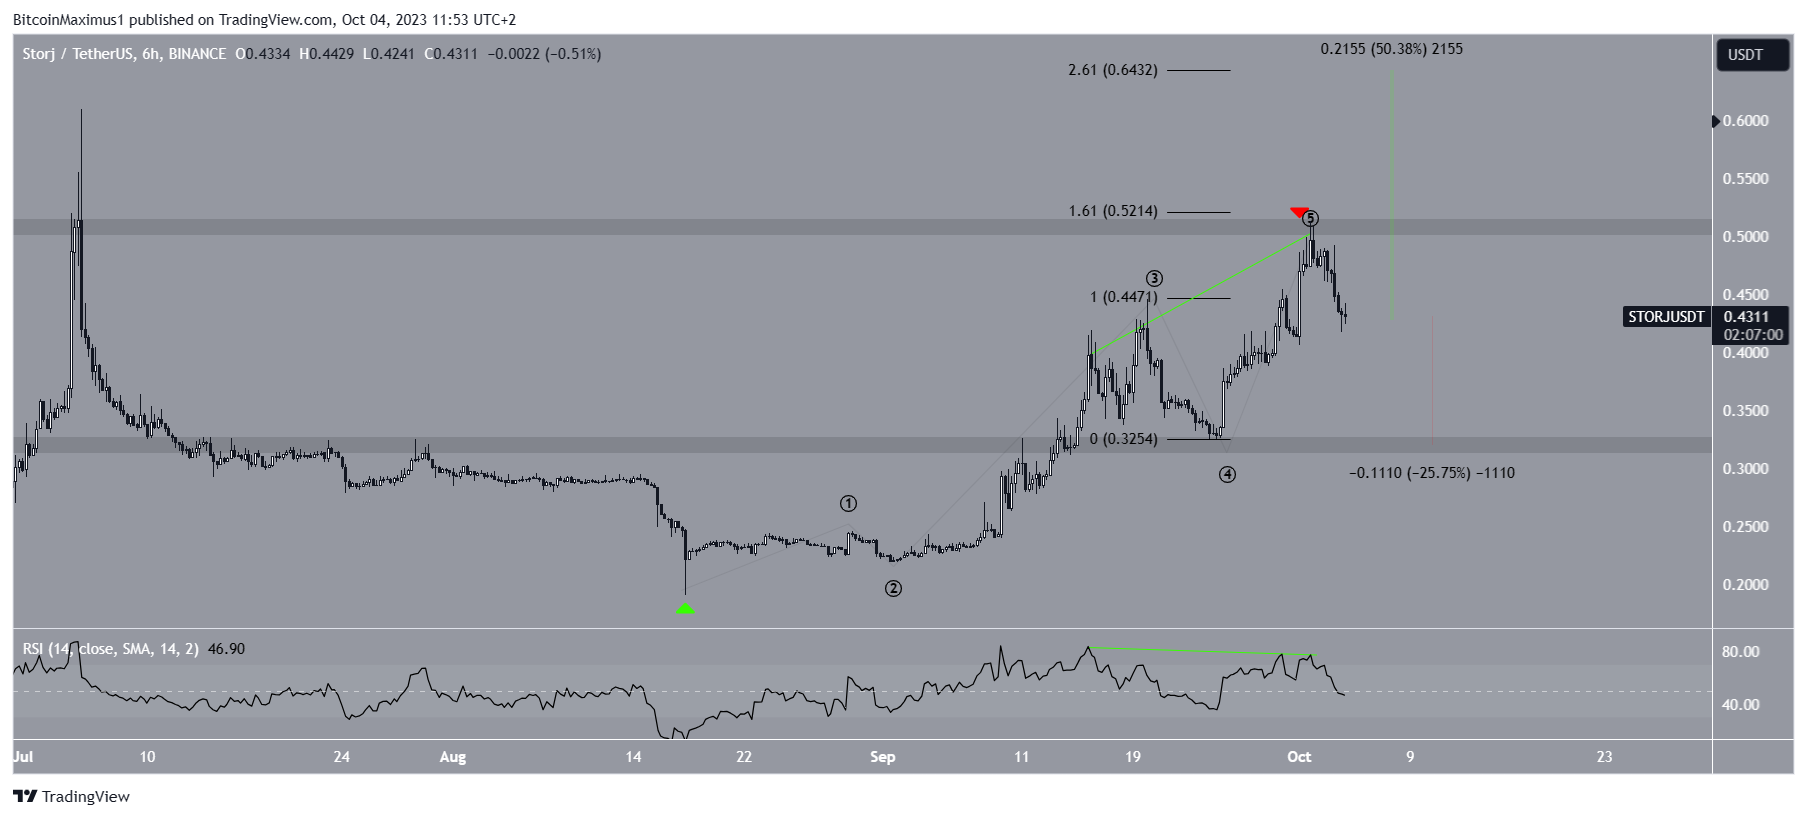
According to Elliott Wave theory, which helps identify long-term price patterns and investor psychology, STORJ has completed a five-wave increase that began on August 15. This price count is characterized by wave five ending at wave four’s 1.61 external Fibonacci retracement level, which is a common level for a local top.
In addition, there was a significant bearish divergence in the RSI between waves three and five, indicating a potential bearish trend. A bearish divergence occurs when there is a decrease in momentum accompanied by a price increase.

Potential Price Movements
If the STORJ count is correct, the cryptocurrency could gradually fall towards the $0.32 horizontal support area, representing a 25% drop from the current price. However, if the price surpasses the $0.51 high, it would indicate that the local top has not been reached yet and may lead to an increase towards the next resistance at $0.64, a 50% gain from the current price.
Hot Take: STORJ Faces Uncertain Future Amidst Market Volatility
The recent rejection from its range high and subsequent decline have cast uncertainty on the future of the STORJ price. While the bullish September provided optimism for investors, the current horizontal trading range and potential retracement suggested by Elliott Wave theory indicate a possible downward trend. Traders should closely monitor the RSI for clearer signals and be prepared for various scenarios, including a further drop towards support or a continuation of the upward movement if resistance is broken.


 By
By
 By
By
 By
By

 By
By
 By
By