The MATIC Price Faces Resistance at $0.60
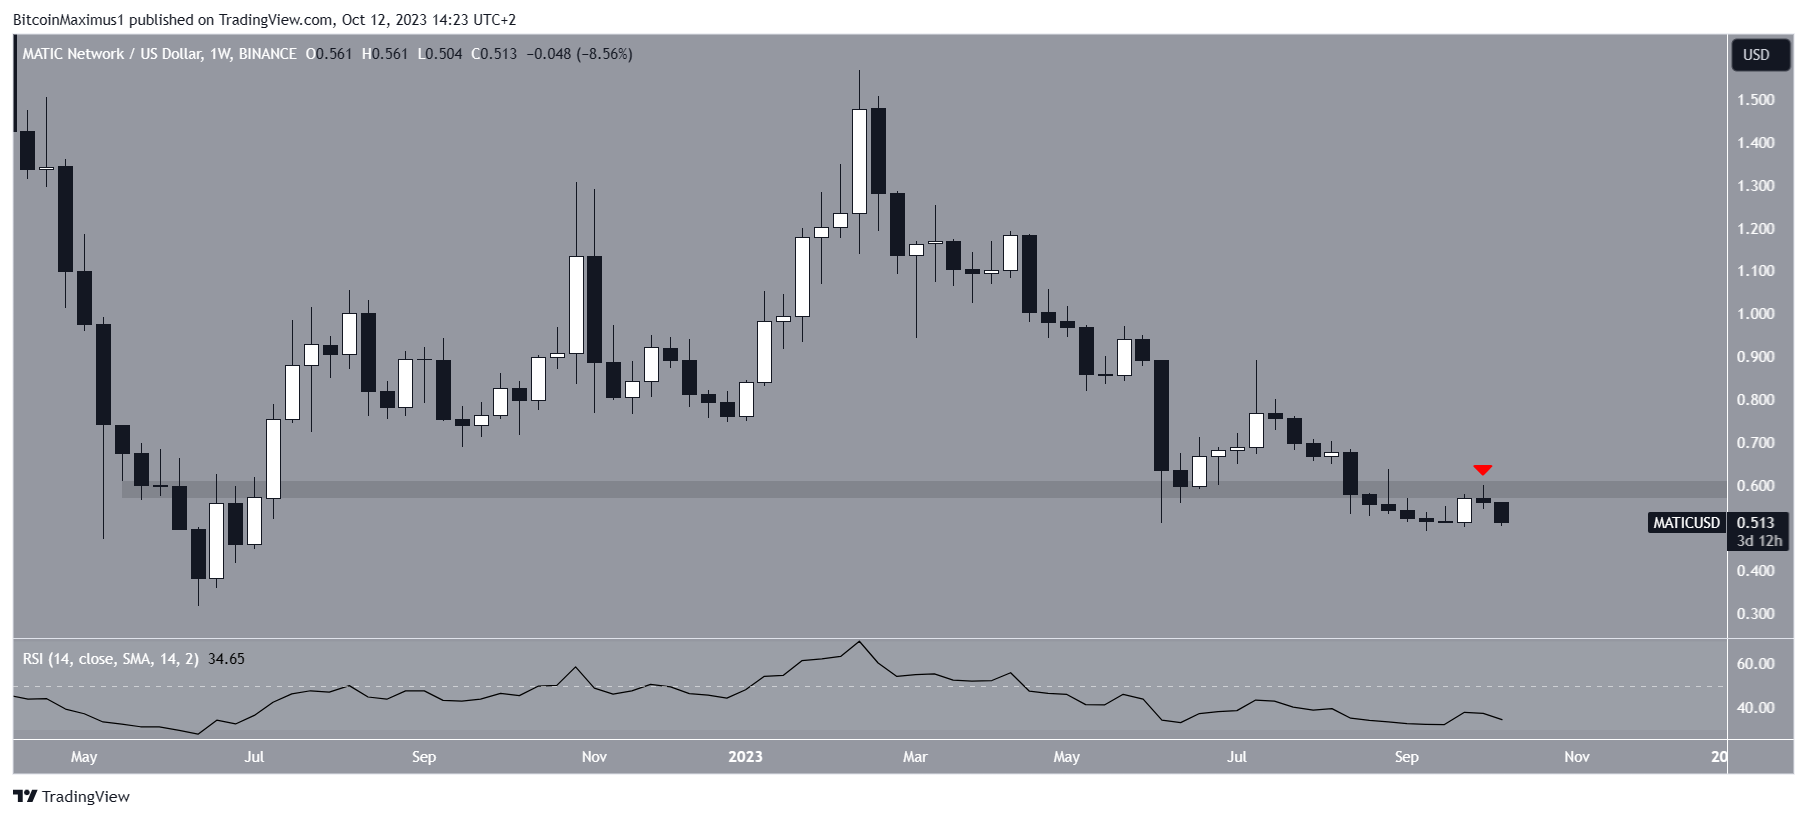
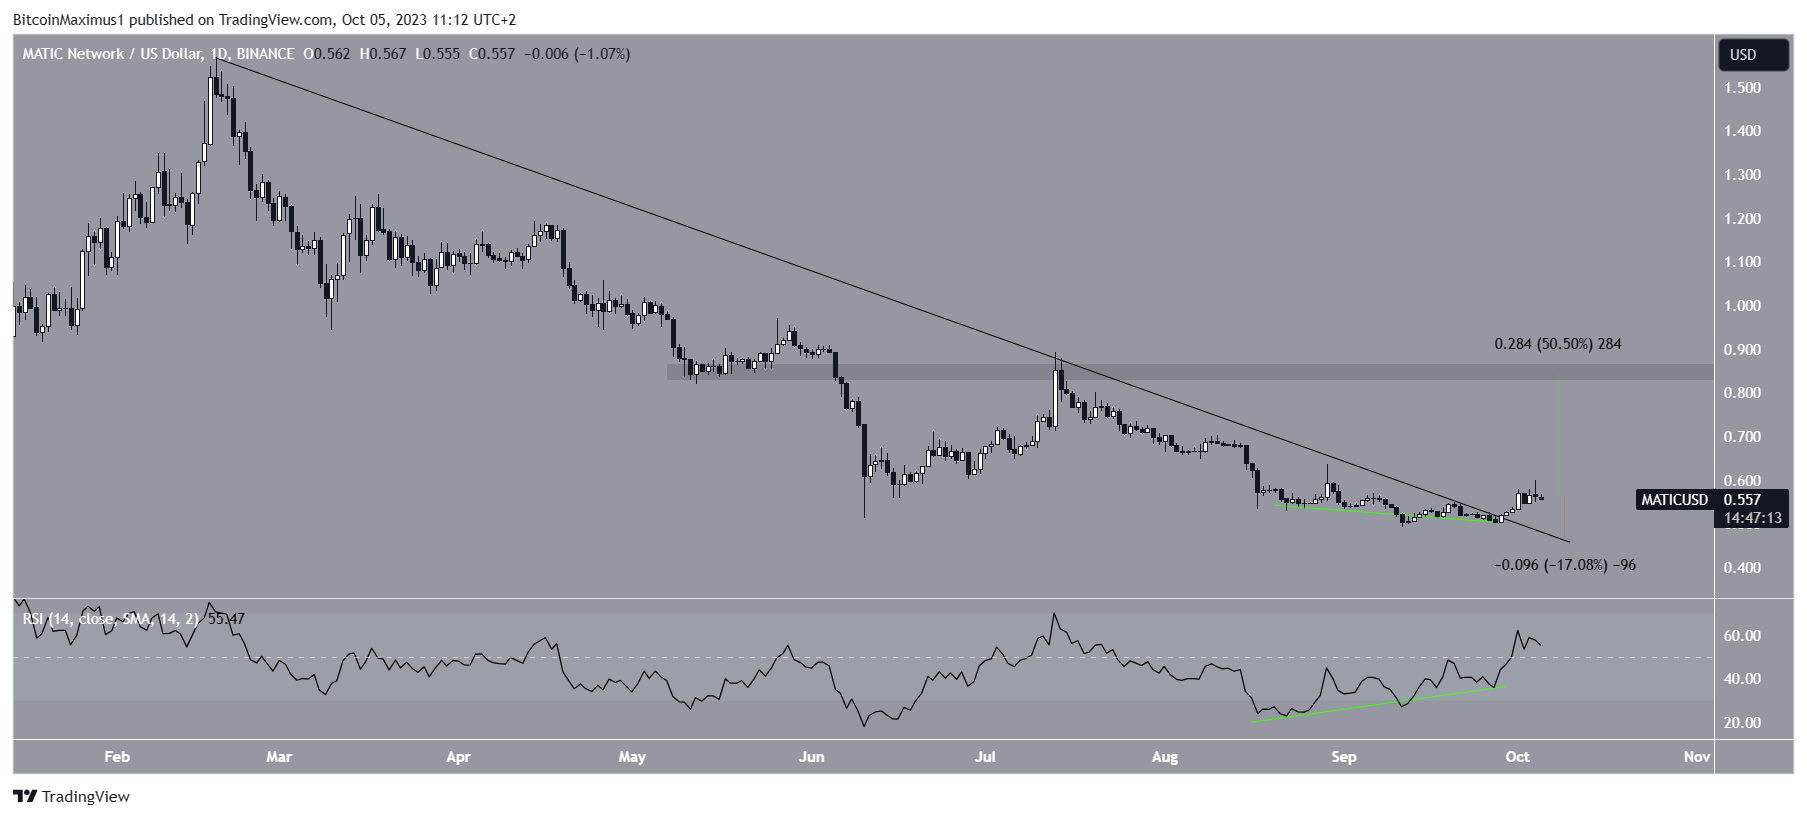
The price of Polygon (MATIC) formed a bearish candlestick last week, confirming the $0.60 horizontal area as a resistance level. On September 29, the price also broke out from a descending resistance trendline in the short term.
MATIC Falls Below Long-Term Resistance
Looking at the weekly timeframe, the technical analysis shows that the MATIC price has broken down from the $0.60 horizontal area. This area had been acting as support since July 2022 until it broke in August 2023.
Last week, there was a significant bounce in the MATIC price, but it was rejected by the $0.60 area, resulting in a bearish candlestick that confirmed the resistance level. The downward movement has continued this week.
It’s worth noting that Google Cloud has become an official validator of the Polygon Network by staking over 10,000 MATIC tokens.

The weekly Relative Strength Index (RSI) indicates a bearish trend. Traders use the RSI as a momentum indicator to determine if a market is overbought or oversold, helping them decide whether to buy or sell an asset. When the RSI reading is above 50 and the trend is upward, bulls have the advantage. Conversely, if the reading is below 50, bears have the upper hand. In this case, the RSI is falling and below 50, indicating a bearish trend.
MATIC Price Prediction: Can Breakout be Sustained?
While the weekly outlook is bearish, the daily timeframe provides a less clear picture. MATIC has broken out from a descending resistance trendline that has been in place since February, suggesting the completion of the previous movement and the start of a new one in the opposite direction.
This breakout was accompanied by a bullish divergence in the RSI, where momentum increased while prices decreased. Such developments often lead to significant breakouts, as seen in MATIC’s case. However, the price failed to sustain its increase after breaking out and fell back towards pre-breakout levels.
If the downward movement continues, MATIC could find support at the descending resistance trendline, currently around $0.45, which is 10% lower than the current price.

Hot Take: Potential for an Increase Above $0.60
Despite the bearish price prediction, if MATIC manages to close above the $0.60 horizontal resistance area on a weekly basis, there is potential for an increase towards $0.85. This would represent a 67% upward movement from the current price.


 By
By
 By
By
 By
By

 By
By
 By
By