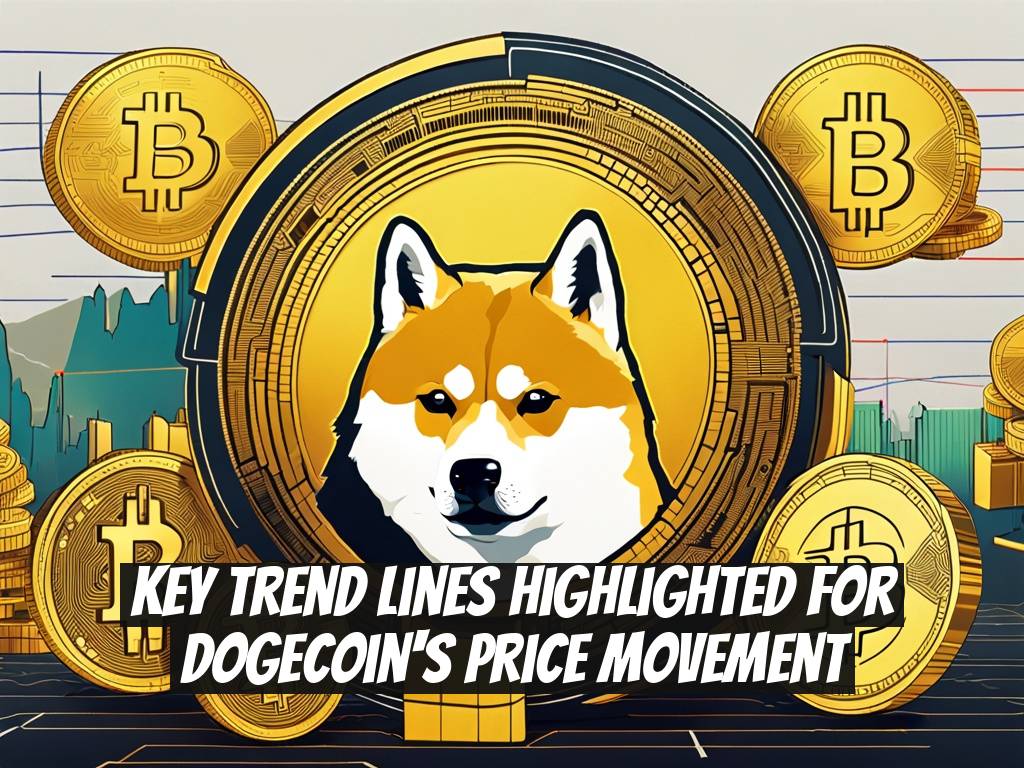
Dogecoin: Will History Repeat Itself? ?
Ah, Dogecoin! The meme that turned into a sensation. Is the "Doge" still alive and kicking, or are we just barking up the wrong tree? If you’ve been following the crypto world, you might have glimpsed some chatter about the Global Liquidity Index and how it relates to Dogecoin’s price action. Sounds a bit technical, right? But hang tight; I’ll walk you through this in a way that even my grandma could understand.
Key Takeaways:
- Global Liquidity Index: Indicates available market liquidity.
- Dogecoin’s Price Action: Current levels are around $0.15, with notable support and resistance points.
- Historical Patterns: Connections between liquidity trends and Dogecoin rallies.
- Watchful Waiting: Keeping an eye on liquidity changes can signal possible market movements.
Subscribe to our Social Media for Exclusive Crypto News and Insights 24/7!
Liquidity is the Name of the Game ?
So, first off, let’s talk liquidity. It’s like the blood flowing through the veins of the market. When liquidity is high, investors feel confident and more willing to put their cash into riskier assets, which includes Dogecoin. Conversely, when liquidity is tight, people tend to hoard their cash, leading to less trading and, well, less fun in the crypto playground.
Kevin (@Kev_Capital_TA), a fellow analyst, has done some impressive legwork analyzing the Global Liquidity Index alongside Dogecoin’s price chart. What caught my eye is how these two elements often dance together. Imagine them at a party, doing a well-choreographed tango. Whenever liquidity trends lower, we often see Dogecoin’s price struggle. However, when liquidity rises, Dogecoin can soar, much like it did in 2021-remember that epic rush that propelled it from under a cent to around $0.74? Pure madness!
The chart Kevin shared illustrates the critical turning points in Dogecoin’s history. It shows alignments of its price action with significant moments of liquidity shifts. Those orange circles? They mark local lows that Dogecoin hit during times of liquidity contraction-like a lil’ safety net that caught its fall. Just think of it as Doge finding a cozy spot to settle down during stormy weather.
Breaking Down Dogecoin’s Price Levels ?

Now, let’s get granular. Currently, Dogecoin’s price is hovering around $0.15. But heh, there’s this thing called the Fibonacci retracement that some traders, including Kevin, pay serious attention to. It basically tells us about potential support and resistance levels. The 0.382 level-sitting cozy at about $0.14225-is a big deal for Dogecoin right now. It suggests that traders are eyeing this level closely. If Dogecoin can hold above it, we might just see some momentum on the horizon.
Historically, when the price breaches certain thresholds, it has triggered explosive rallies. Like when you accidentally tap a soda can and it goes everywhere-chaos ensues! But in the crypto world, that chaos can sometimes equal profit. Sweet, sweet profit!
How Can This Help You? Practical Tips ?

Alright, let’s be real for a sec. As thrilling as Dogecoin can be, it’s also playful. Here are some handy tips if you’re thinking about throwing your hat into the Doge ring:
Keep an Eye on Liquidity: Monitor the Global Liquidity Index. If it starts climbing, that could indicate a favorable environment for risk assets like DOGE.
Fibonacci Levels Matter: Familiarize yourself with Fibonacci levels; they can often guide entry and exit points.
Watch the News: External factors like market sentiment, economic news, and major movements in Bitcoin can influence Dogecoin’s price action.
Stay Cool: Don’t let your emotions dictate your trading decisions. Hype can lead to pressure; patience is your buddy!
- Revisit the Charts: Analyze historical price movements alongside the liquidity index. Trends often give insight into future price action.
It’s Complicated, But So Is Love ️
I mean, if there’s anything we’ve learned from the unpredictable world of Dogecoin, it’s that nothing is certain. It’s like that rollercoaster ride you just can’t predict-the highs, the lows, the screaming, and oh, the joy when you’re back up again. Kevin’s insights remind us that while there are no surefire guarantees in trading, patterns sometimes give us clues.
So, what’s the takeaway? Pay attention to how the Global Liquidity Index evolves; it might signal the next wave for Dogecoin. Could we be on the brink of yet another meme-fueled explosion? Or are we facing a slow drift into the obscurity of the forgotten internet?
Before you jump in feet-first, ponder this: Are you ready to embrace the rollercoaster, or would you prefer the steadiness of traditional investments? It’s a wild ride either way!


