Litecoin Price Analysis: Holding Steady
The price of Litecoin (LTC) has remained relatively stable at $72 and is trading above the moving average lines. If it continues to hold above the 21-day simple moving average, the market will likely retest the previous resistance level of $79. However, if it breaks below the 21-day SMA, the price may fall below the 50-day SMA and current support at $70, returning to its previous range of $60 to $70.
Litecoin Indicators Analysis
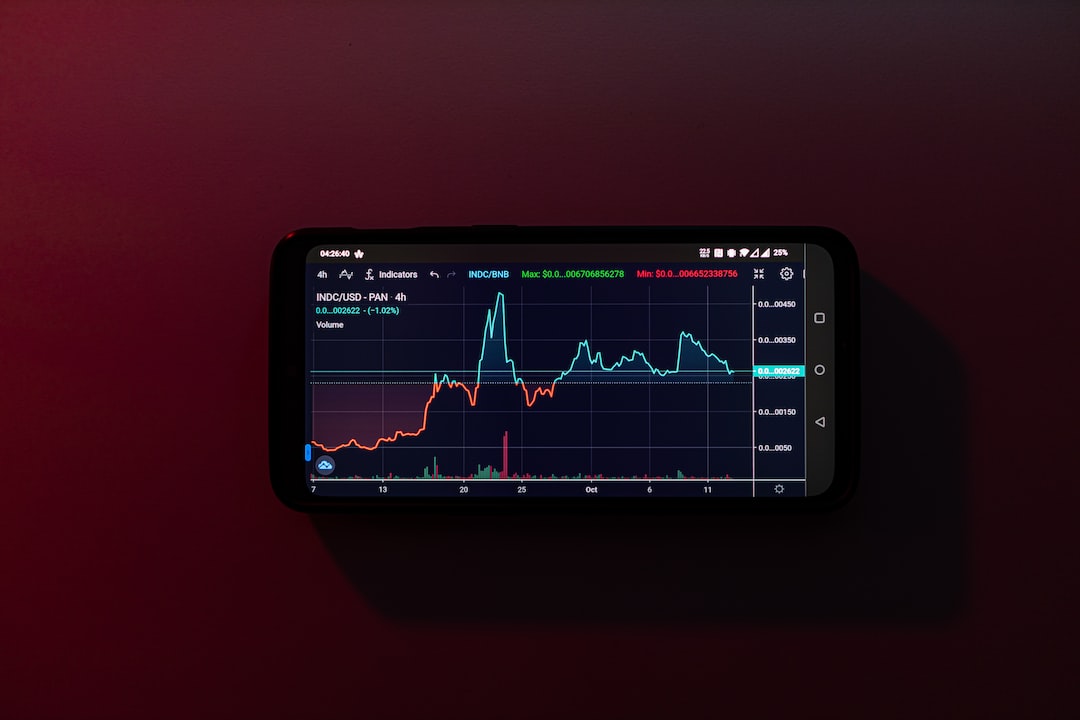
The bears have broken below the 21-day simple moving average line, indicating a potential bearish trend. However, the bulls have bought the dips and the altcoin is showing signs of an uptrend. The prices on the 4-hour chart suggest a sideways movement for Litecoin.
Technical Indicators
Resistance levels: $100, $120, $140
Support levels: $60, $40, $20
What’s Next for Litecoin?
After a drop on December 23, Litecoin traded between $71 and $74 before recovering. If it returns above the 21-day moving average, it will continue its uptrend. On December 19, Litecoin hit a low of $68 but then rebounded to reach a high of $71.
Hot Take: Litecoin Holds Steady Amidst Market Fluctuations
The price of Litecoin has managed to remain steady despite market fluctuations. With support from moving average lines and potential resistance levels ahead, Litecoin may continue its upward trajectory. However, if it breaks below key support levels, it could return to its previous price range. Keep an eye on technical indicators and market trends to gauge the next move for Litecoin.


 By
By
 By
By
 By
By
 By
By
 By
By