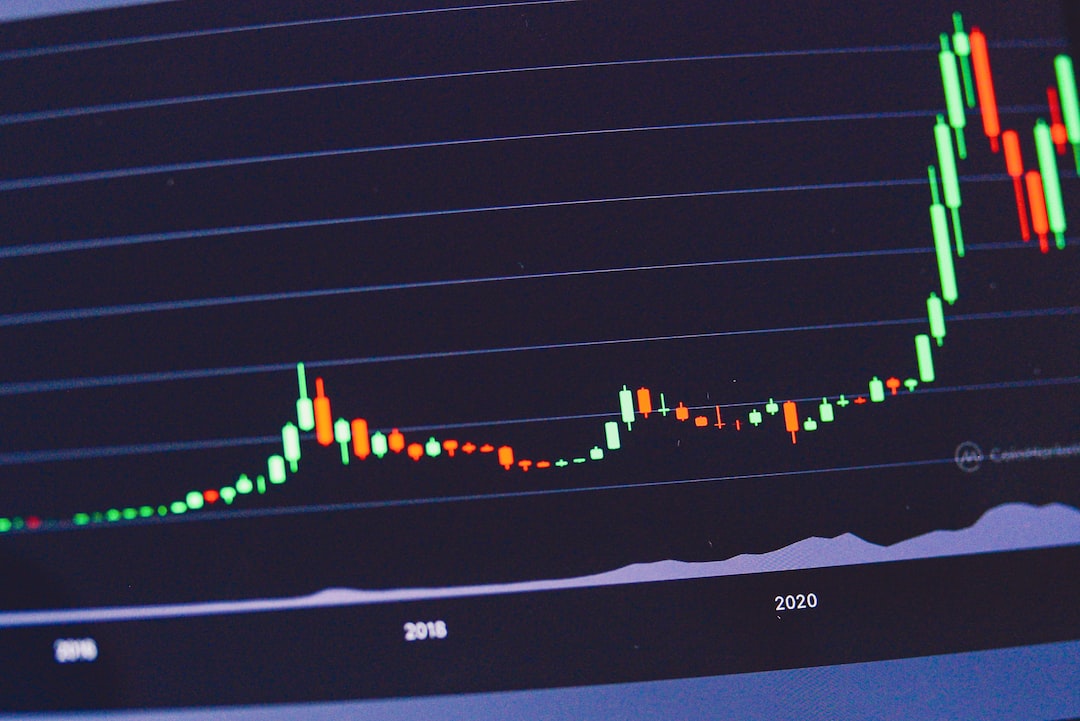
“ The Importance of Knowing How to Read a Crypto Chart “
If you’ve ever looked at a crypto chart and wondered when the right time to buy or sell is, you’re not alone. Understanding how to read a token chart is one of the most valuable trading skills you can have. Let’s dive into this essential aspect of crypto analysis.
“ Fundamental vs. Technical Analysis in Crypto “
When it comes to crypto analysis, you’ll encounter two main types: fundamental and technical analysis. Fundamental analysis involves understanding a project’s basic components, such as its team, social media presence, and financial metrics. On the other hand, technical analysis involves evaluating price movements and identifying patterns in charts. This may seem daunting, but it’s crucial for making informed trading decisions.
“ Understanding Crypto Charts “
Crypto charts represent time intervals, volumes, and historical prices in a visual format. They allow you to identify patterns based on historical price movements, which can help you spot market opportunities. Candlestick patterns, such as bearish and bullish patterns, are essential elements of crypto charts. These patterns can indicate future price increases or declines, providing valuable insights for traders.
“ Total DeFi TVL and Its Importance “
Total Value Locked (TVL) refers to the total value of assets locked into a protocol, such as DeFi. Monitoring the TVL chart can help determine the right time to invest in a DeFi protocol. For example, the DeFi sector currently has a TVL of $46.7 billion, down by 74% from its all-time high. The combined TVL of the crypto market grew exponentially between 2020 and 2021, but these figures have since been reduced during the bear market.
“ Analyzing Google Search Volume for Insights “
Search scores on Google Trends exhibit a correlation with the price of Bitcoin. Increased searches for the term “Bitcoin” can signal a heightened interest in cryptocurrency. However, the current search volume suggests that the crypto market is still at levels seen in 2019. “Crypto” search trends are currently at their lowest point since December 2020, indicating apathy in the market.
“ Leveraging Weekly Crypto Developers Indicators “
Developer activities play a critical role in the crypto industry, as they are behind the ecosystems and protocols shaping the sector. Strong developer activities often indicate bullish market conditions. Monitoring charts showing developer activities can provide valuable insights for traders.
“ Other Essential Charts for Informed Decisions “
In addition to the previously mentioned charts, ultrasound.money for Ethereum metrics and Perps volume are instrumental for understanding market trends. Leveraging these charts can help you make well-informed decisions, preventing panic buying and minimizing uninformed choices.
“ Hot Take: Be Informed, Make Informed Choices “
It’s essential to understand how to read crypto charts to make informed trading decisions. Remember that the information presented is for educational and informational purposes only, and it’s vital to conduct your due diligence before making any investment decisions. By leveraging these essential charts, you can stay ahead in the ever-evolving crypto market.


 By
By
 By
By
 By
By

 By
By