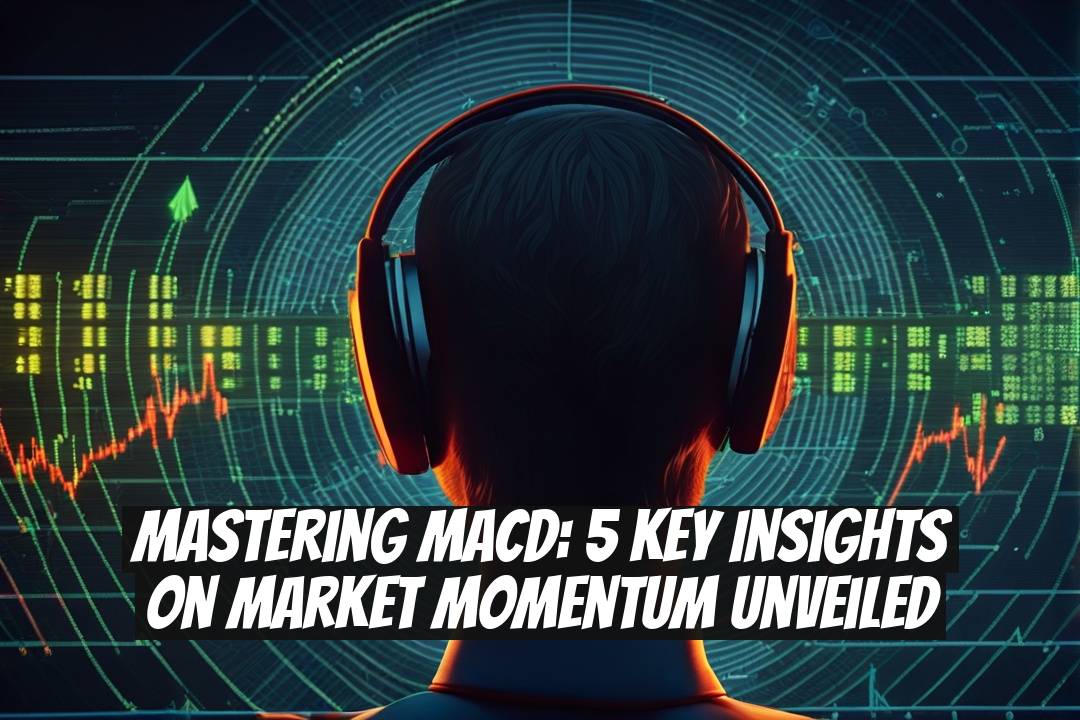
? Understanding MACD: Your Radar for Crypto Trading Success!
Diving into the world of crypto can often feel like navigating through a dense fog. So, let’s arm you with an essential tool-MACD, or Moving Average Convergence Divergence. This nifty little indicator isn’t just jargon; it’s your radar for spotting market trends before they go boom! ?
Key Takeaways:
- What is MACD? A powerful momentum indicator that gauges market trends.
- Components: Understand the MACD Line, Signal Line, and Histogram for better trading decisions.
- Why Use MACD?: Identifies bullish/bearish signals and helps in strategizing entry and exit points.
- Practical Application: See MACD in action with real BTC/USD data.
- Expert Tips: Combine it with other indicators for enhanced accuracy.
Subscribe to our Social Media for Exclusive Crypto News and Insights 24/7!
Alright mate, let’s break this down. The crypto market is as volatile as a rollercoaster on steroids, right? That’s why having a solid grasp of technical indicators like MACD isn’t just handy; it could be the difference between watching your investment soar or plummet like a lead balloon.
What is MACD? ?

So, first things first, what exactly is this MACD thing? Think of it as a speedometer for market momentum, shining a light on whether the bulls are charging ahead or if the bears are lurking in the shadows. It consists of three main components-let’s get into those!
Components of MACD

MACD Line (Blue Line): This is your key momentum gauge.
- If it’s shooting upwards, it means savvy traders are eyeing strong buying signals. If it dips, selling pressure might be creeping in.
Signal Line (Orange Line): Here’s where it gets juicy!
- A crossover of the MACD Line above the Signal Line is like a green light for buying. Conversely, a crossover below screams “sell” louder than a seagull stealing your chips at the beach!
- Histogram (Red/Green Bars): Think of this as the gap between the two lines.
- Bigger bars mean strong momentum-perfect for gauging whether you should jump into action or take a step back.
Why Traders Favor MACD ?
You may wonder why the crowd is raving about MACD. Well, apart from helping you to spot new trends early, it’s a champion at finding the best entry and exit points. It’s like having the insider scoop on a film’s plot twist before the credits roll!
Here’s a little cheat sheet:
- Spotting Trends: Identify shifts before they hit the masses.
- Picking Your Battles: Buy low during surges and think about selling when momentum fades.
- Strength Measurement: Distinguish between the big fish and the small fry-who’s holding, and who’s fleeing?
Practical Example on BTC/USD ?
Let’s get practical. Imagine you’re examining the BTC/USD pair. If the MACD Line is at 326 and the Signal Line at -279, and you spot that lovely crossover-bam! That’s your bullish signal. Check those expanding green bars? Looks like the momentum is too good to pass up!
Expert Tips for Pros ?
Now, here’s the nugget of wisdom from seasoned traders:
- Combine MACD with Moving Averages: Whether it’s EMA or SMA, these buddies will give your signals a boost.
- Watch Market Conditions: Testing MACD in sideways markets can lead to some dodgy signals-play it cool and don’t dive in blindly.
If you’re keen to get your hands dirty, platforms like Bitfinex let you practice with MACD. It’s as easy as pie-just log in, pick a trading pair, and start experimenting!
Final Thoughts: Catching the Market Waves ?
At the end of the day, MACD is your trusty compass as you navigate the unpredictable seas of crypto trading. Its strength lies in its ability to sense the wind changes before they’re obvious-like feeling a shift in air pressure before rain starts pouring down.
So, are you ready to put MACD into action and chart your own destiny in the crypto space? Or will you wait for the next wave to wash away missed opportunities? Remember, in this game, fortune favors the prepared!


