The Recent Surge in Polkadot (DOT) Price
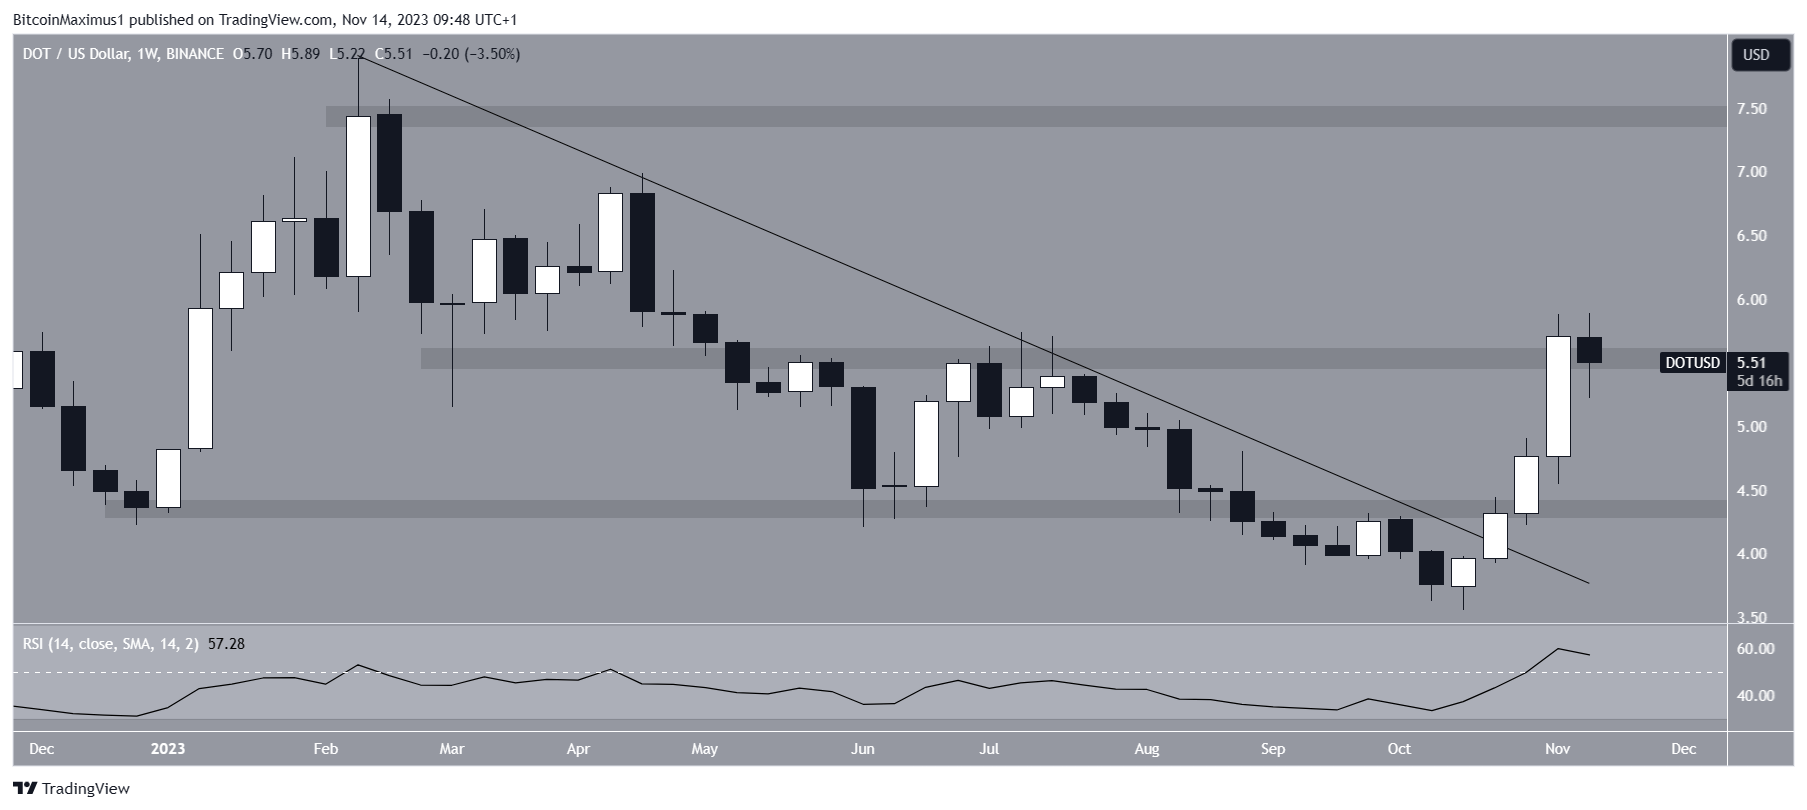
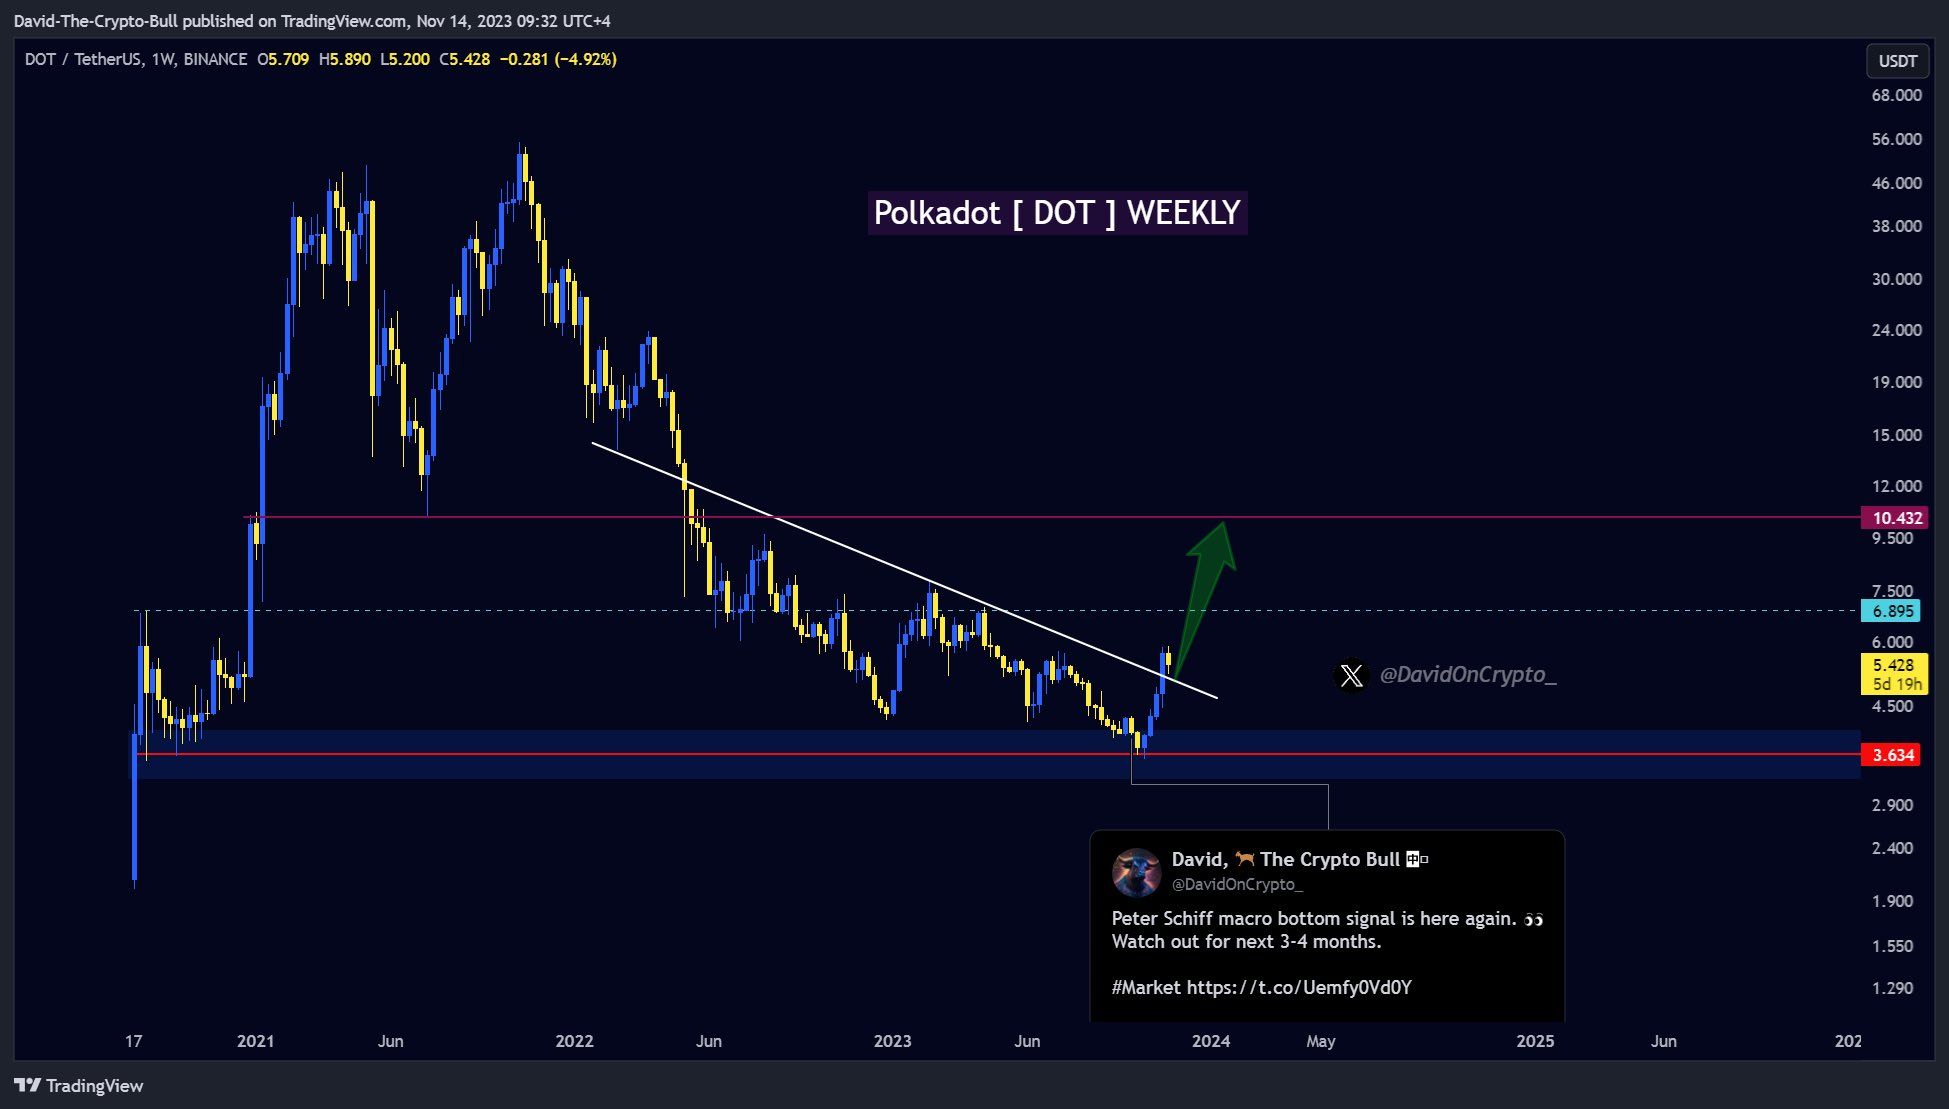
Polkadot (DOT) has seen a continuous increase in its price for the past four weeks, reaching a high of $5.90 this week. This surge led to a breakout from a descending resistance trend line and the reclaiming of two horizontal resistance areas.
Polkadot (DOT) Continues to Rise
An analysis of DOT’s weekly time frame shows a decline below a descending resistance trend line starting from February, hitting a low point of $3.56 in October. This downward movement resulted in the breach of the crucial $4.40 horizontal support area.
However, there has been an upward movement in the DOT price over the past four weeks. The Polkadot price broke out from a descending resistance trend line in October and reached a high of $5.90 this week, reclaiming the $4.40 and $5.50 horizontal areas.
Use of Relative Strength Index (RSI)
Traders often use the Relative Strength Index (RSI) as a momentum indicator to evaluate market conditions and make decisions on buying or selling assets based on overbought or oversold signals. The RSI is currently rising and stands above 50.

Analyst Sentiments on Polkadot (DOT)
Cryptocurrency traders on X are predominantly bullish about Polkadot’s future prospects. Many analysts believe that the price will continue to rise, with some predicting double-digit figures soon.

Predictions for DOT Price Movement
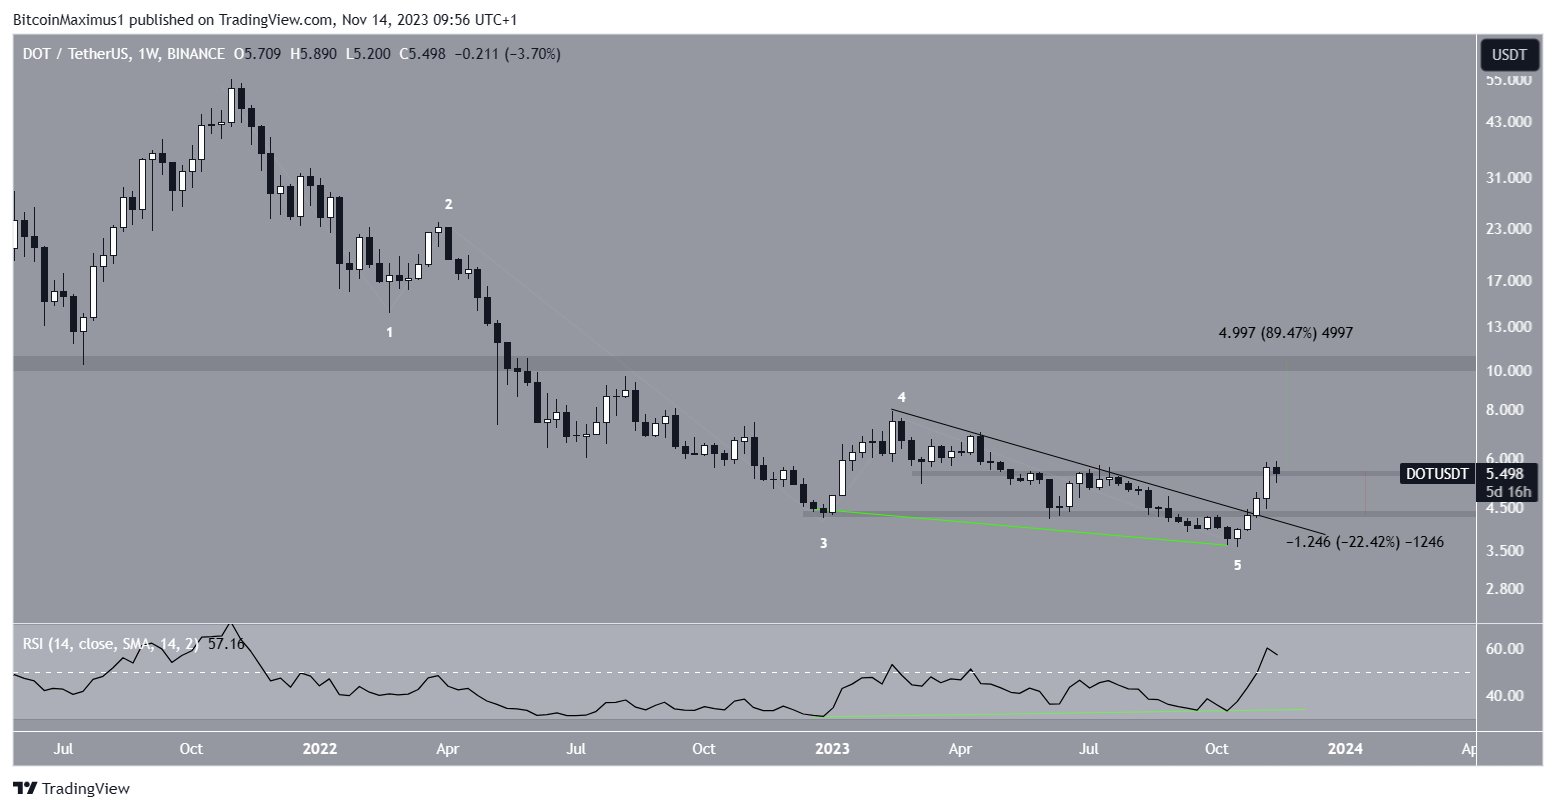
Technical analysts are using the Elliott Wave theory to identify recurring long-term price patterns and anticipate significant movements in the DOT price. The prevailing Elliott wave count suggests that the Polkadot price completed a five-wave downward movement since its all-time high in November, signaling the initiation of a new movement in the opposite direction.
Bullish divergence in the weekly RSI further supports ongoing upward momentum, raising expectations for a potential 90% increase from the current price to reach $10 if the upward trend continues.

Hot Take: Potential for Double-Digit Growth
The recent surge in Polkadot’s price, supported by technical analysis and bullish sentiment among cryptocurrency traders, indicates potential for significant growth in the coming weeks. However, caution is advised as a weekly close below key support areas could trigger a sharp decrease in price.


 By
By
 By
By
 By
By
 By
By
 By
By