The Solana (SOL) Price Analysis: Will the Downtrend Continue?
The price of Solana (SOL) has experienced a decline after reaching a monthly high of $24.79 on October 2. Within seven days, the price dropped to $22.08.
Solana Breaks Out but Fails to Reach Resistance
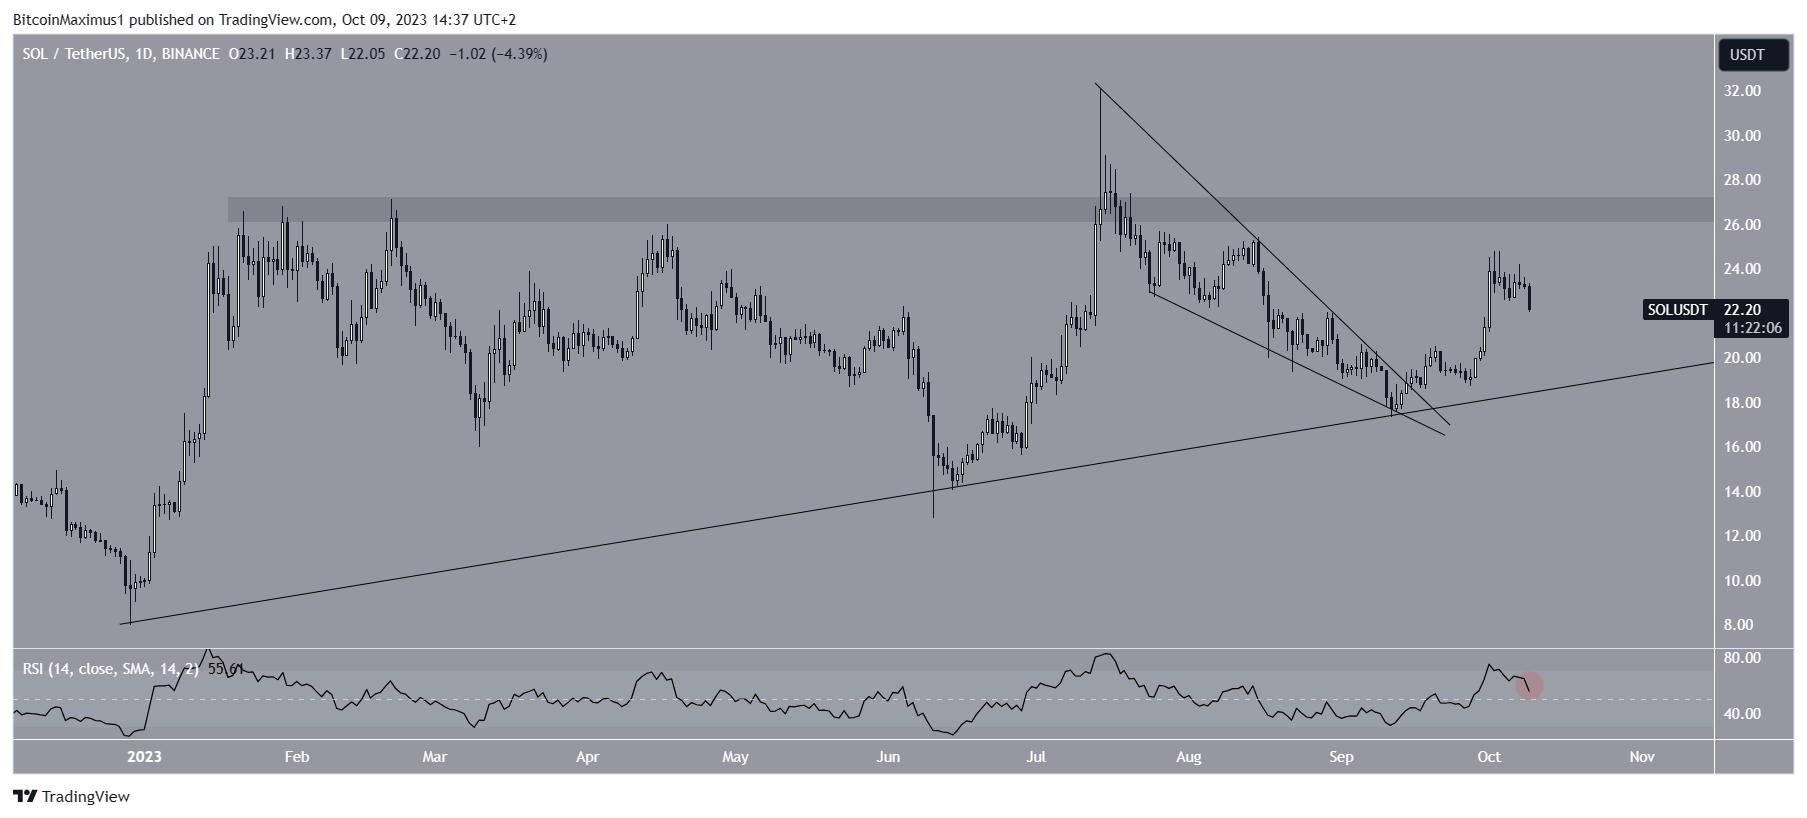
On the daily timeframe, Solana broke out from a descending wedge pattern on September 15, leading to a high of $24.80 on October 2. However, the price has since fallen, following the overall trend in the crypto market.
Despite the breakout, Solana did not reach the long-standing resistance area at $27. This resistance level has been in place since the beginning of the year.
On the other hand, SOL is currently trading above a long-term ascending support trendline at $20. This support level has also been in place since the start of the year.

The Undetermined RSI and its Implications
The daily Relative Strength Index (RSI) is currently undetermined. Traders use the RSI as a momentum indicator to assess whether a market is overbought or oversold, which helps them make decisions on buying or selling an asset.
When the RSI reading is above 50 and the trend is upward, it indicates an advantage for bulls. Conversely, if the reading is below 50, the opposite is true. Currently, the RSI is decreasing but still above 50, resulting in conflicting signals regarding the trend’s direction.
SOL Price Prediction: When Will the Downtrend End?
Technical analysts employ the Elliott Wave theory to identify long-term price patterns and investor psychology, aiding in determining the trend’s direction.
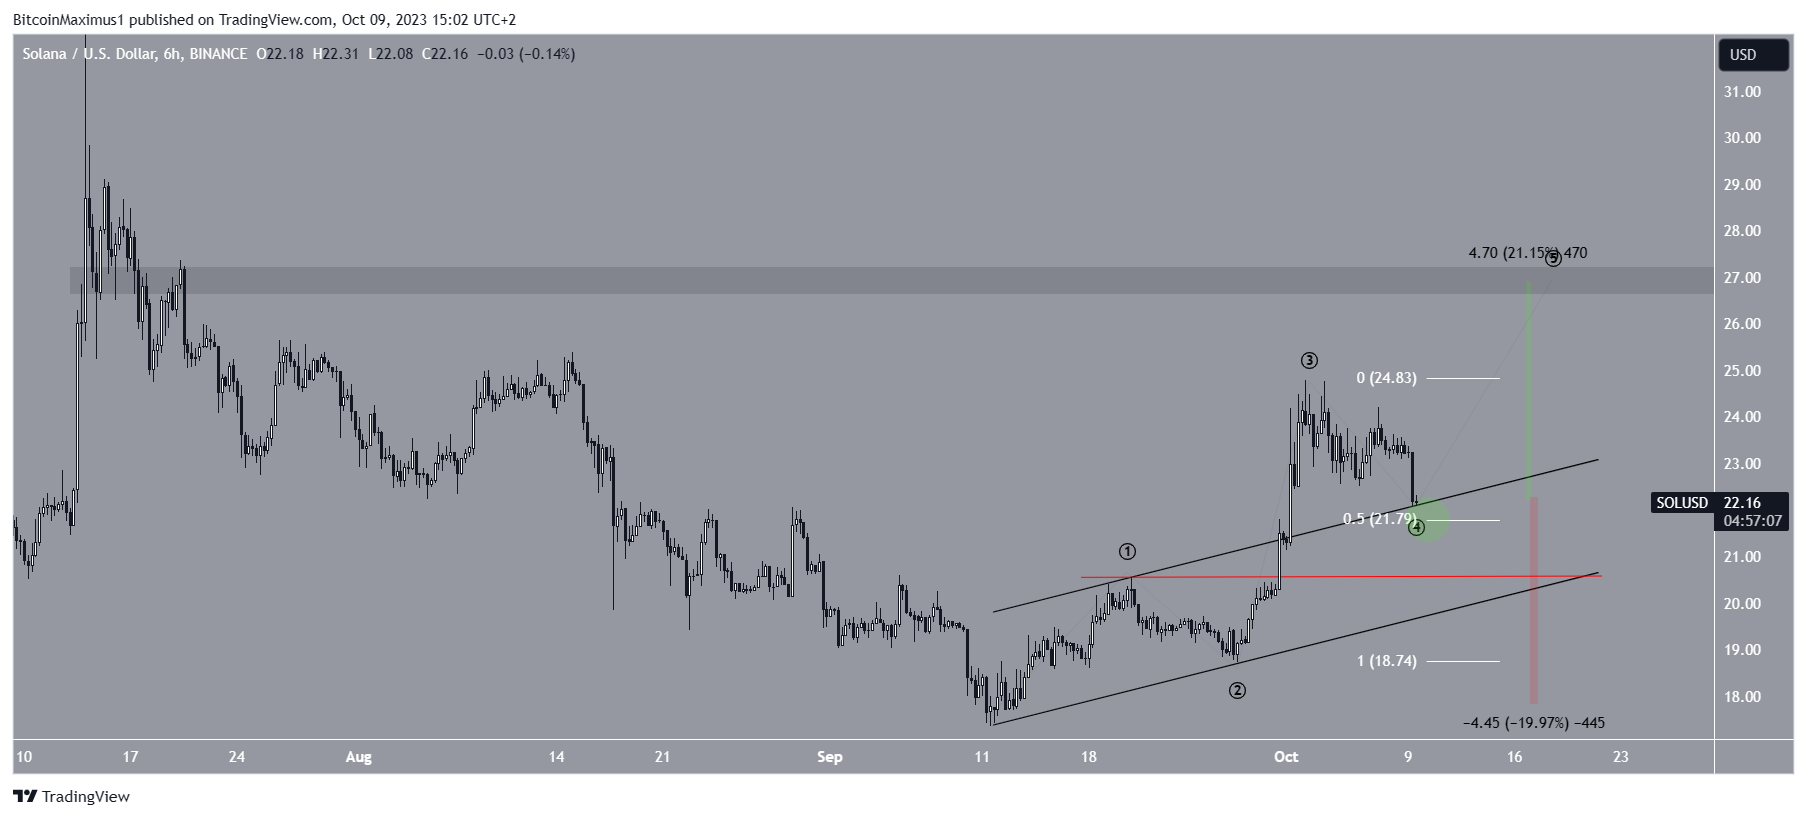
On the six-hour timeframe, a bullish wave count suggests that SOL’s upward movement will continue. If this count is correct, SOL started a new five-wave upward movement on September 11 and is currently in wave four of this increase.
Wave four might conclude soon as SOL trades within a confluence of support levels formed by the 0.5 Fib retracement support level and the resistance trendline of an ascending parallel channel that SOL previously broke out from. If all goes well, the cryptocurrency could see a 20% increase and complete the fifth wave at $27.

However, if SOL’s price falls below the wave one high at $20.50, it will invalidate the bullish count. In that scenario, SOL could decrease by 20% and drop to the $18 horizontal support area.
Hot Take: Uncertain Times Ahead for Solana (SOL)
The recent decline in Solana’s price following its breakout and failure to reach resistance raises questions about its short-term performance. With conflicting signals from the RSI and the potential for a bearish scenario if key support levels are broken, it remains uncertain when the downtrend will end for SOL. Traders should closely monitor price movements and key levels to make informed decisions.


 By
By

 By
By
 By
By
 By
By
 By
By