Aptos (APT) Breaks Out from 270-Day Resistance
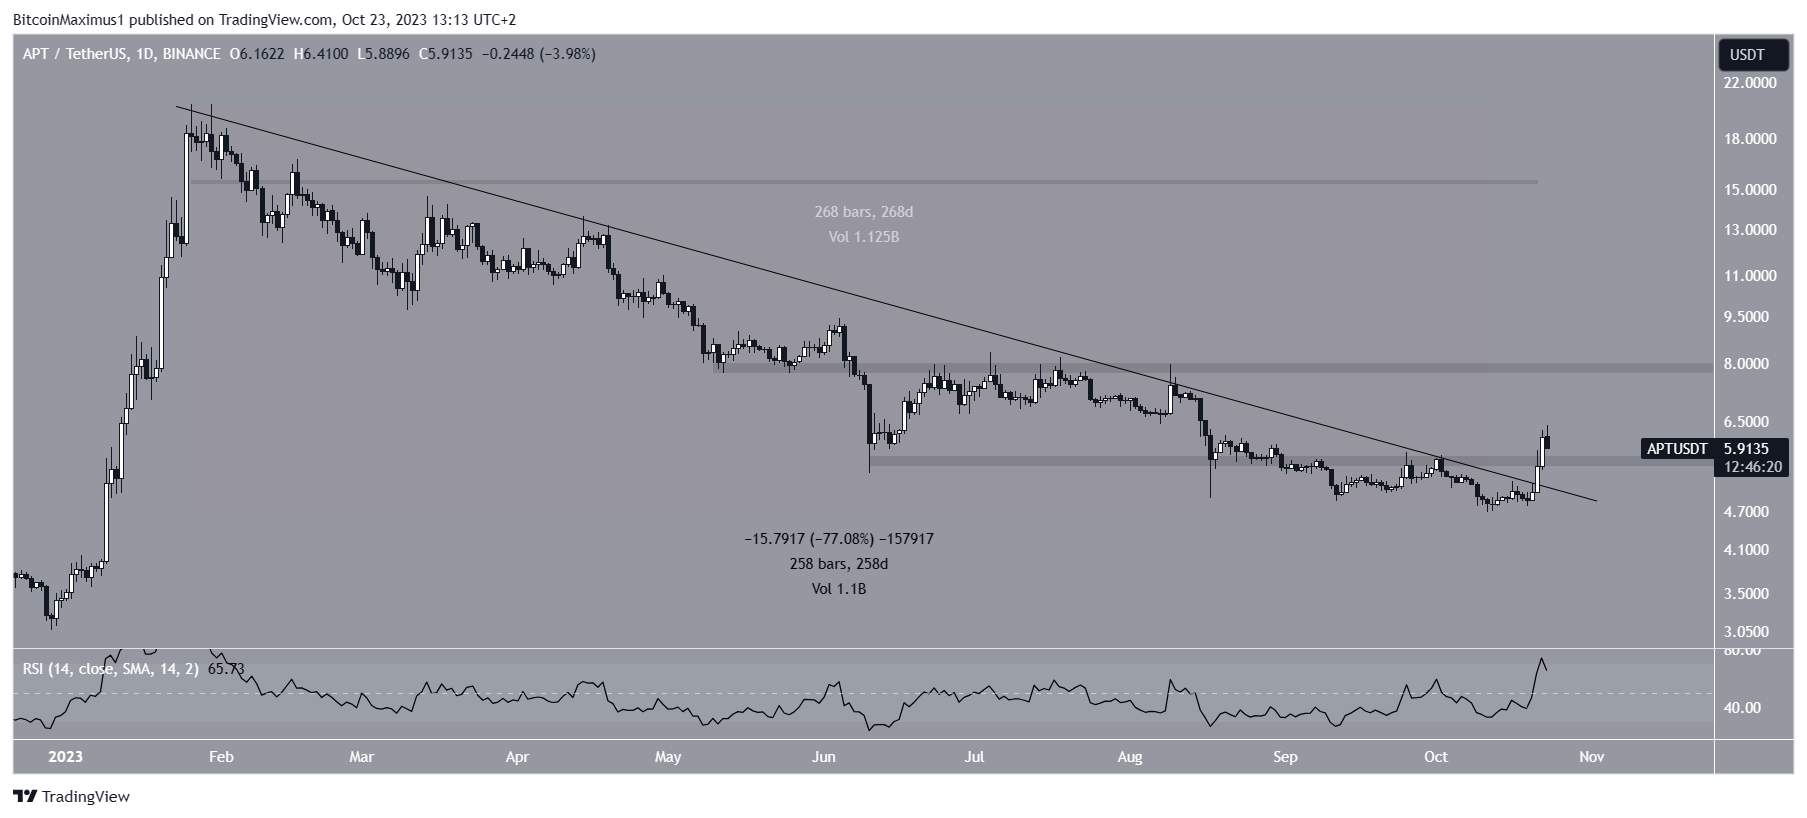
The price of Aptos (APT) recently broke out from a descending resistance trendline that had been in place for almost 270 days. This breakout occurred on October 21 and led to a high of $6.41. Prior to the breakout, APT had experienced a significant decrease, falling from an all-time high of $20.40 on January 24 to a low of $4.70 on October 11.
APT Reclaims Horizontal Resistance Area
Following the breakout, Aptos reclaimed the $5.65 horizontal resistance area. This is a positive sign for the altcoin as it suggests that buyers are stepping in at this level and pushing the price higher.

Bullish Momentum Indicated by RSI
The daily Relative Strength Index (RSI) for APT is currently above 50 and increasing, which indicates a bullish trend. The RSI is a momentum indicator used by traders to determine if a market is overbought or oversold. Readings above 50 suggest bullishness, while readings below 50 suggest bearishness.
Predicting APT’s Price Movement
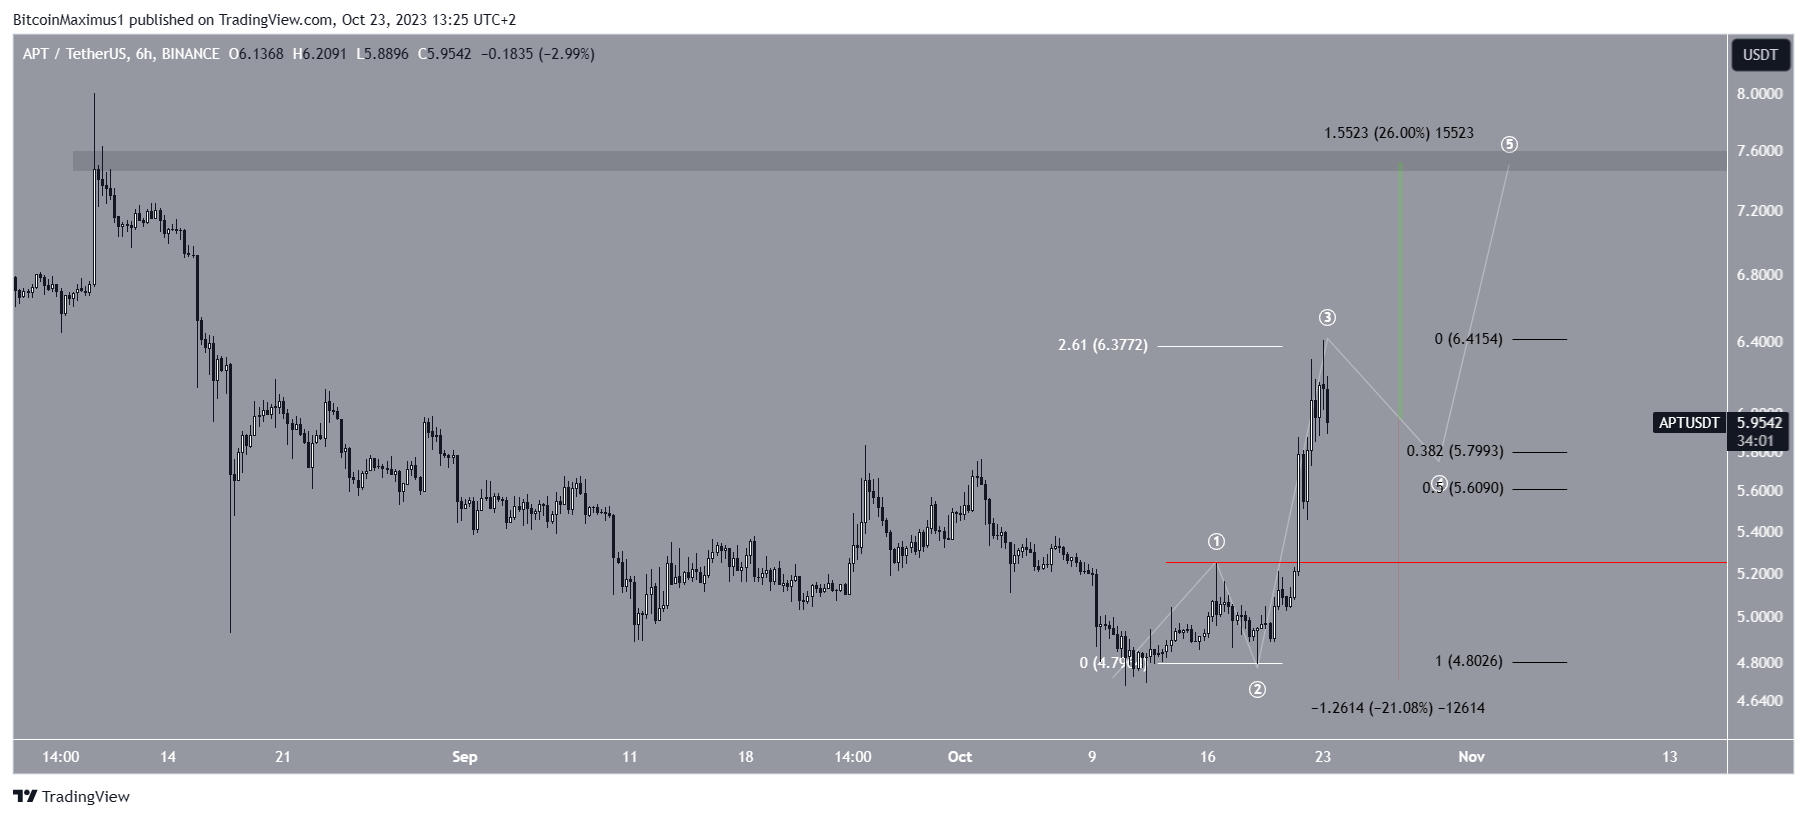
According to technical analysts using the Elliott Wave theory, APT is likely in wave four of a five-wave upward movement. The breakout from the descending resistance trendline validates this wave count. Wave four is expected to be a corrective wave, leading to a decrease towards the 0.382-0.5 Fibonacci retracement support area at $5.65 and $5.80.

After the correction, APT could potentially increase to the next resistance level at $7.60, completing wave five and resulting in a 26% upward movement. However, if the price drops below the wave one high of $5.22, it would invalidate this wave count and suggest a 21% drop to the $4.70 support area.
Hot Take: Aptos (APT) Breaks Out of Long-Term Resistance Trendline, Indicating Potential Bullish Movement
Aptos (APT) recently broke out from a descending resistance trendline that had been in place for almost 270 days. This breakout has led to a reclaiming of the $5.65 horizontal resistance area and suggests potential bullish momentum for APT. Technical analysis using the Elliott Wave theory indicates that APT may be in wave four of a five-wave upward movement, with a possible increase to $7.60 in the future. However, if the price drops below $5.22, it could invalidate this prediction and result in a decrease to the $4.70 support area.


 By
By
 By
By
 By
By


 By
By