The Solana (SOL) Total Value Locked (TVL) Reaches New Yearly High
The price of Solana (SOL) has been steadily increasing, reaching a new yearly high last week. Currently trading at $24.80, the price has experienced an accelerated rate of increase since September 27.
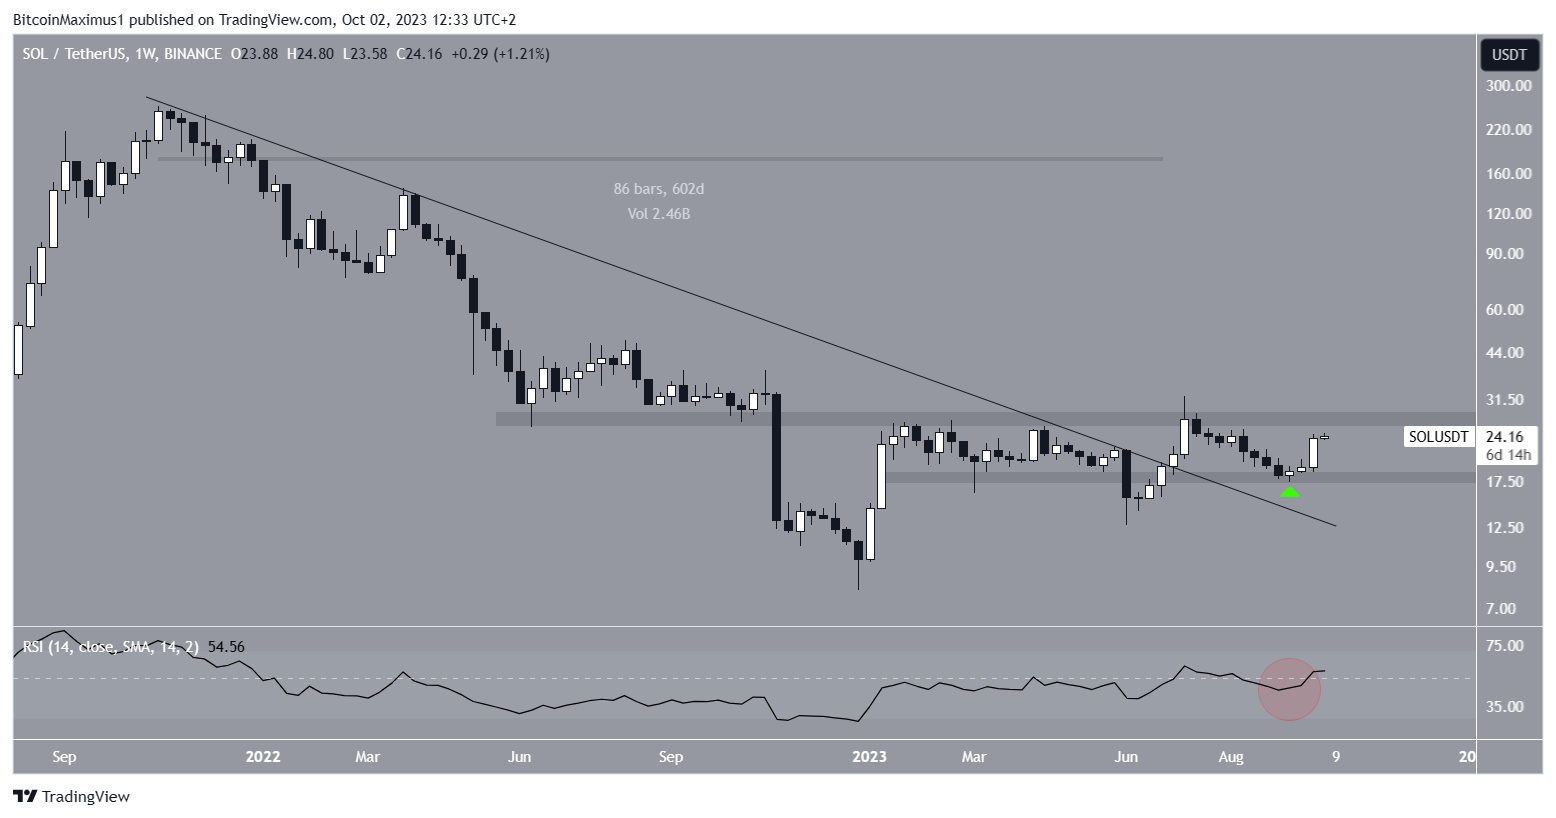
Solana’s price movement is also contained within a long-term horizontal range between $18 and $32.
Solana’s Bullish Week
An analysis of SOL’s weekly time frame reveals a significant uptrend since the beginning of the year. During this period, SOL managed to break free from both the $18 resistance level and a descending trendline that had been in place for 600 days.
After breaking out, Solana reached a peak of $32 before encountering resistance at $27. In September, the price returned to the $18 support level and rebounded, confirming it as a reliable support zone. This has led to the creation of a trading range between $18 and $32.

The weekly Relative Strength Index (RSI) is currently undetermined. The RSI is a crucial tool for investors to identify momentum and make informed buying or selling decisions. An RSI above 50 during an uptrend is considered positive, while a figure below 50 is bearish. However, the RSI for SOL is currently moving above and below 50, failing to confirm the trend’s direction.
SOL Price Prediction: Increase Accelerates After Daily Breakout
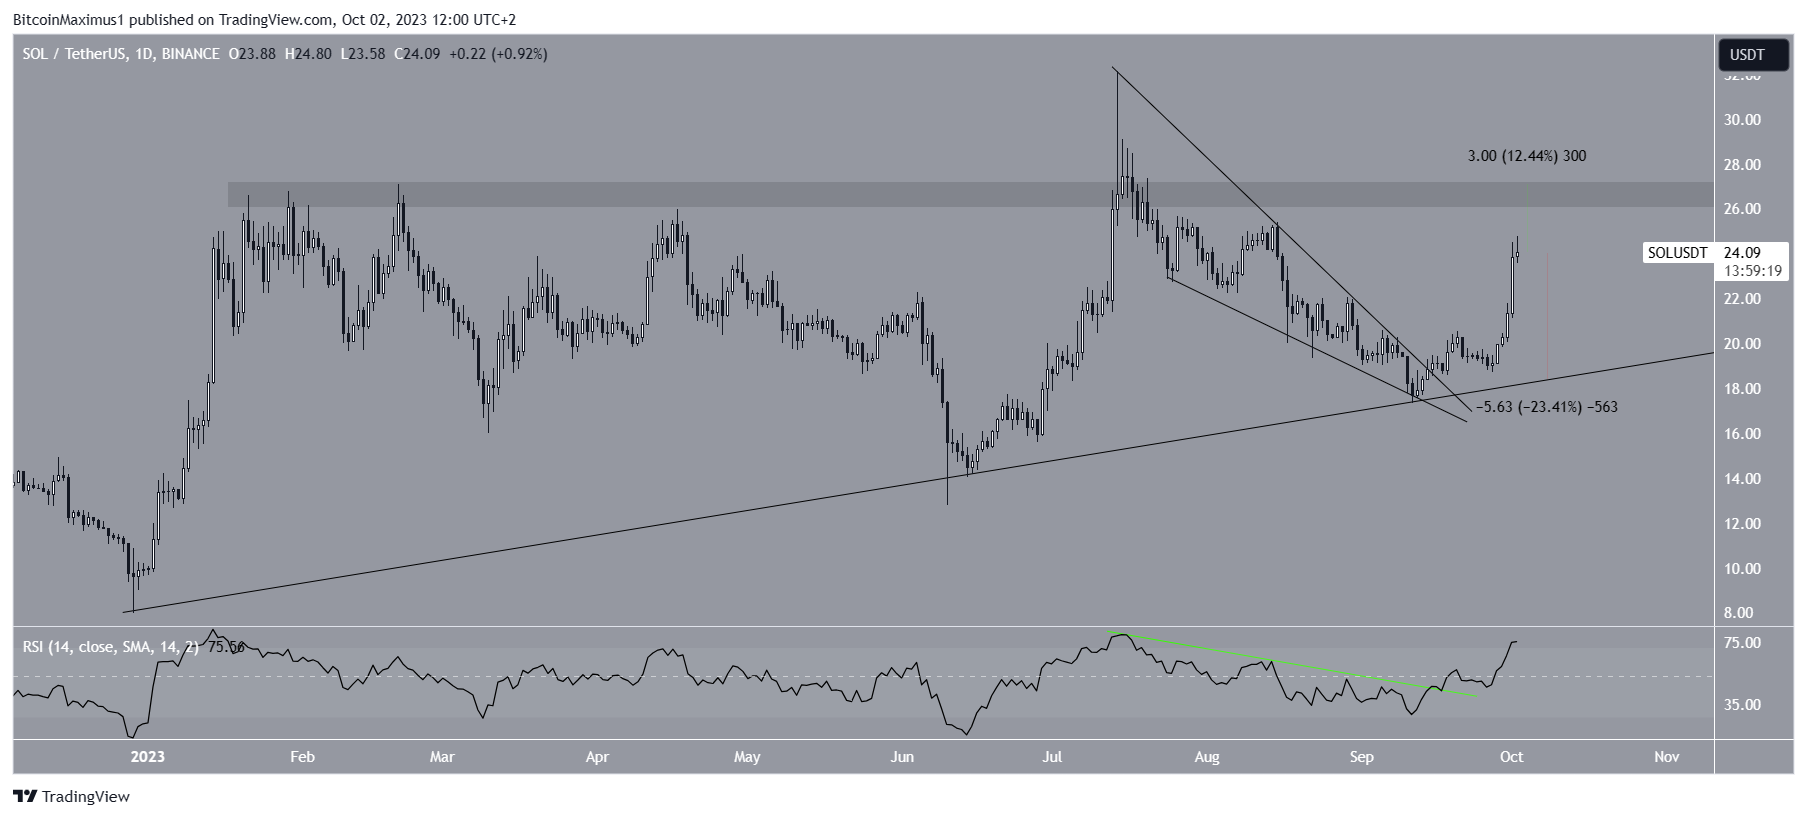
On the daily timeframe, SOL’s price acceleration can be attributed to a breakout from a descending wedge pattern on September 14. Since then, the price has created higher lows and experienced a 30% increase, reaching $24.80.
The increase in Solana’s total value locked (TVL) may have also contributed to the price rise. TVL reached a 2023 high of $337.49 million last week and has been steadily growing.
The daily RSI supports the continuation of the price increase. Traders use the RSI as a momentum indicator to determine market conditions. When the RSI reading is above 50 during an upward trend, bulls have an advantage.

If the RSI reading is below 50, the opposite is true. Currently, the RSI has broken out from its descending resistance trendline and moved above the 50 trendline, indicating a potential continuation of the price increase. The next resistance level at $27 is 12% above the current price.
Hot Take: SOL Price May Experience a Sudden Drop
While the SOL price prediction remains bullish, there is a possibility of a sudden drop in momentum that could lead to a 23% fall to the long-term ascending support line at $19.
For BeInCrypto’s latest crypto market analysis, click here.


 By
By
 By
By
 By
By
 By
By
