The Solana (SOL) Price Surge
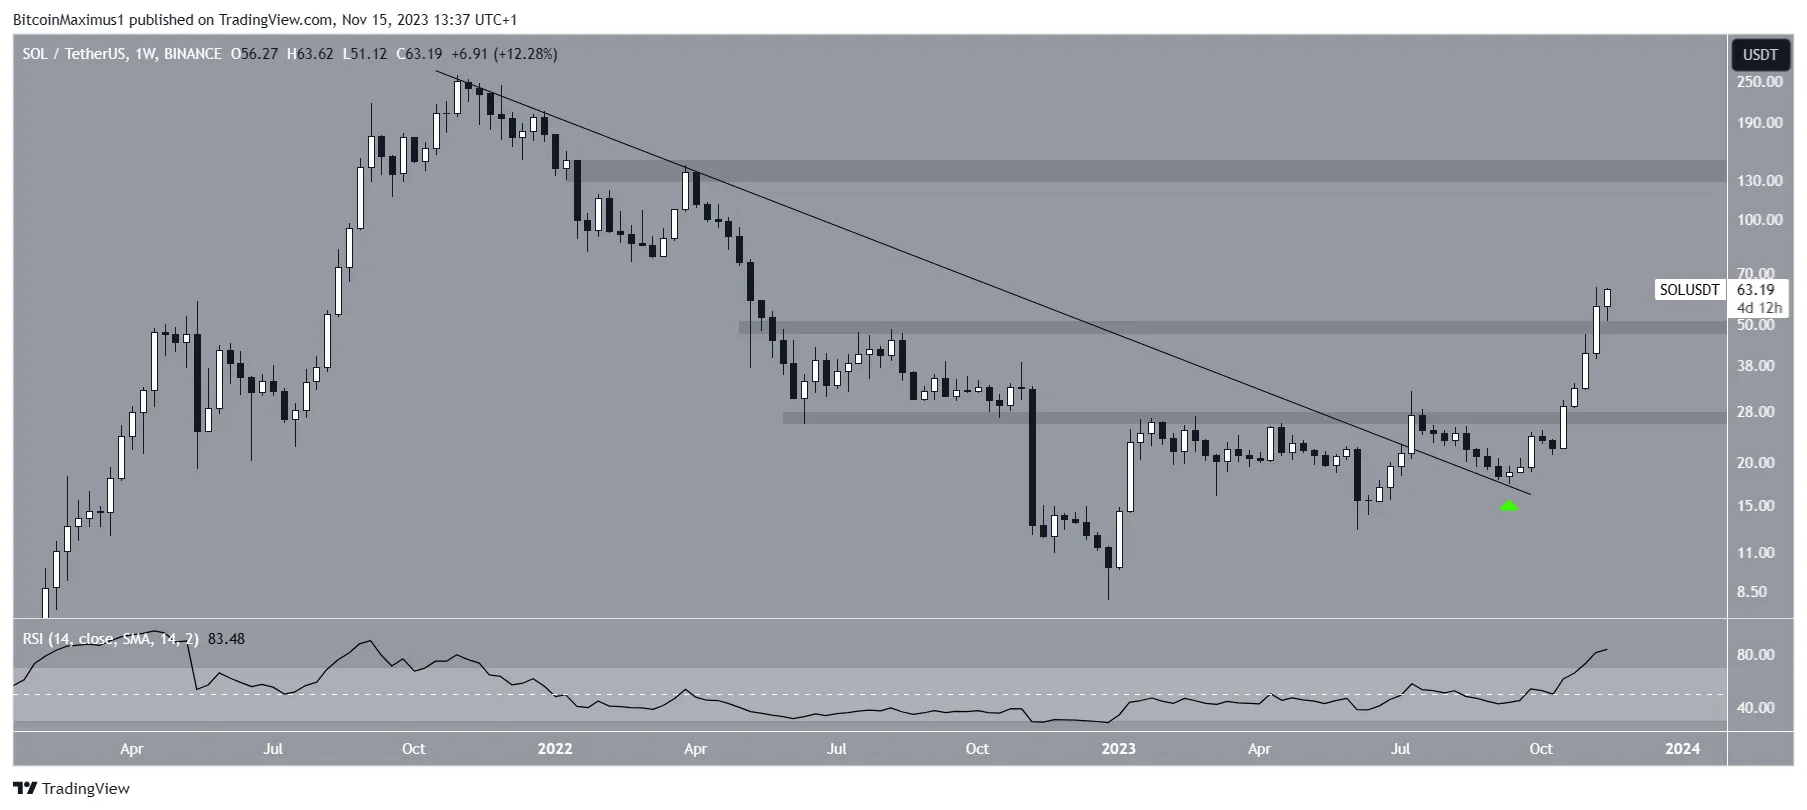
The price of Solana (SOL) reached a new yearly high of $64 last week and is trying to break out again, following a parabolic increase since the start of October. The question now is how long this surge will continue.
Solana (SOL) Breaks Above $50 Resistance
SOL has experienced a significant surge since breaking a long-term descending resistance trend line in September and confirming it as support. This rapid upward movement saw SOL surpass the $27 and $50 resistance areas during its ascent. The closing price of $56 last week was the first above $50 since May 2022, and the price also reached a new yearly high of $64.
Relative Strength Index (RSI) Analysis
Traders often use the Relative Strength Index (RSI) to gauge momentum and identify potential buying or selling opportunities based on overbought or oversold conditions. An RSI above 50 and an upward trend suggest a favorable scenario for bulls, while readings below 50 imply the opposite. The current RSI value of 82 is well below the all-time high of 99, indicating a bullish trend.

FTX Account Deposits and Price Prediction
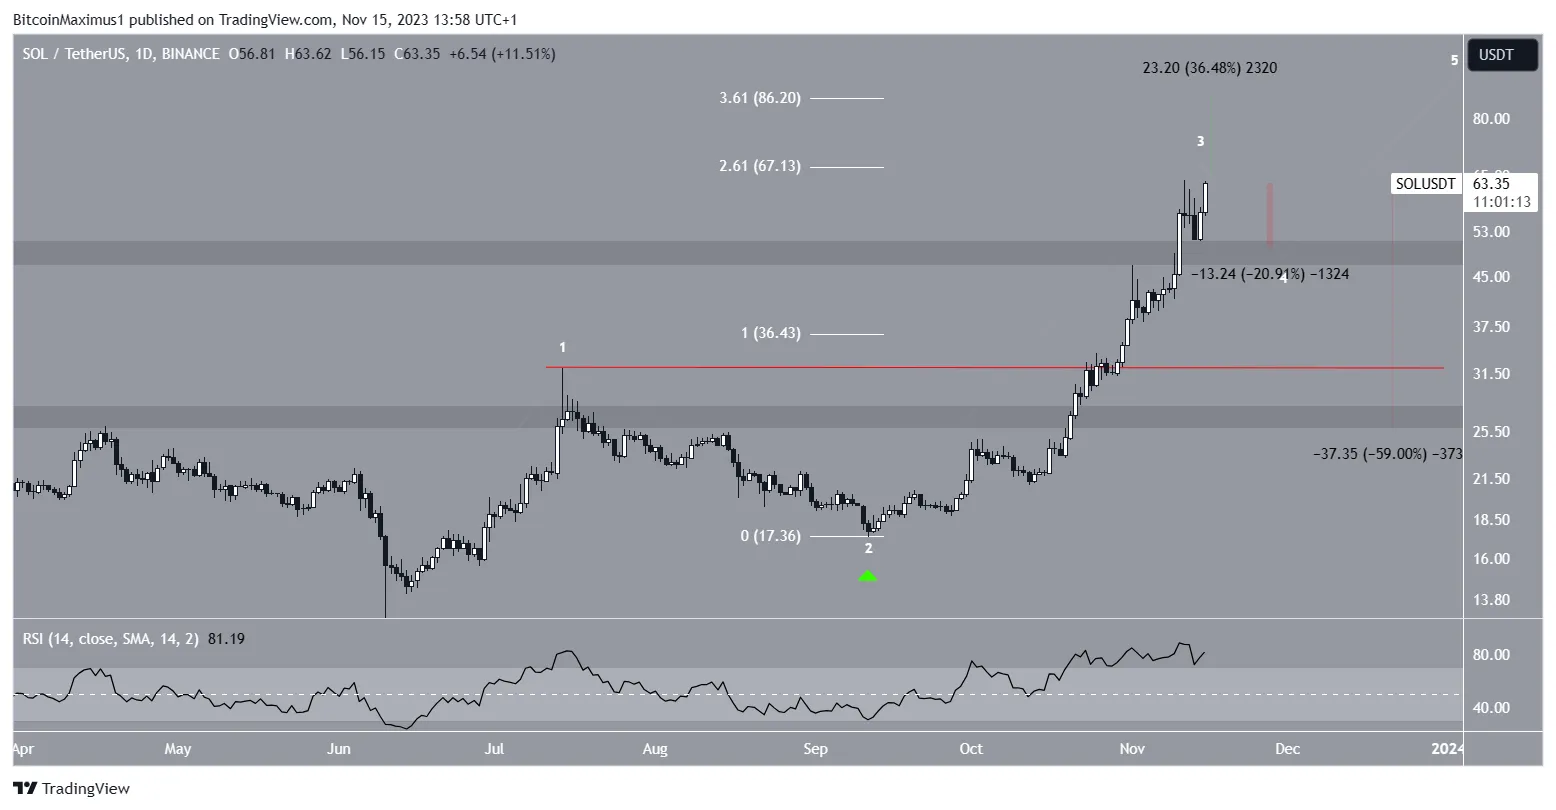
Lookonchain tweeted that an FTX account deposited $13.6 million worth of SOL to the Kraken exchange, potentially indicating sell pressure in the future. Technical analysts are using the Elliott Wave Theory to predict that the SOL price may reach a local top soon, potentially around the $67 resistance level.
Predictions Based on Elliott Wave Theory
The current analysis suggests that the SOL price may increase by another 35% and reach $86 if it breaks out above $67. However, if it gets rejected at this level, it could correct by 20% and reach the $50 support area to complete wave four.

Closing Thoughts on SOL Price Predictions
Based on various technical analyses, there are conflicting predictions about where the SOL price will go next. While some suggest further upside potential towards $86, others indicate a potential correction towards $50 before resuming its increase.
Hot Take
Uncertainty Surrounding Solana’s Future Price Movement
The recent surge in Solana’s price has sparked diverging opinions among analysts about its future trajectory. With conflicting predictions based on technical indicators like RSI and Elliott Wave Theory, there is uncertainty about whether SOL will continue its upward trend or face a corrective phase in the near future.

