The Frax Share (FXS) Price Breaks Long-Term Resistance
The price of Frax Share (FXS) has broken out from a 230-day descending resistance trendline, resulting in a 7% gain in just one day. Additionally, the price has also cleared a short-term descending resistance trendline. This breakout raises the question of whether there is further potential for growth.
Frax Share Clears Long-Term Resistance
Since February, the FXS price has been falling under a descending resistance trendline, hitting a low of $4.60 on June 15. Despite an upward movement, the price was rejected by the trendline on August 15. However, it created a higher low in September and eventually broke out from the resistance trendline after 230 days.
Following the breakout, the FXS price returned to validate the trendline as support and began an upward movement on October 12. However, the altcoin still trades close to its pre-breakout levels.

Launch of New Staking Vault Incentives Holders
The recent increase in the FXS price may be attributed to the launch of sFRAX, a staking vault that aims to capitalize on Treasury Yields. Users can stake FRAX and earn the Treasury Bill Yield, starting at 10%. According to Frax Shares’ founder Sam Kazemian, the yield may decrease to 5% but will not fall below that.
The Frax ecosystem currently issues three stablecoins: FRAX, FPI, and frxETH. These stablecoins are pegged to different assets such as the USD, a basket of consumer goods, and the Ethereum price.
FXS Price Prediction: Is the Breakout Legitimate?
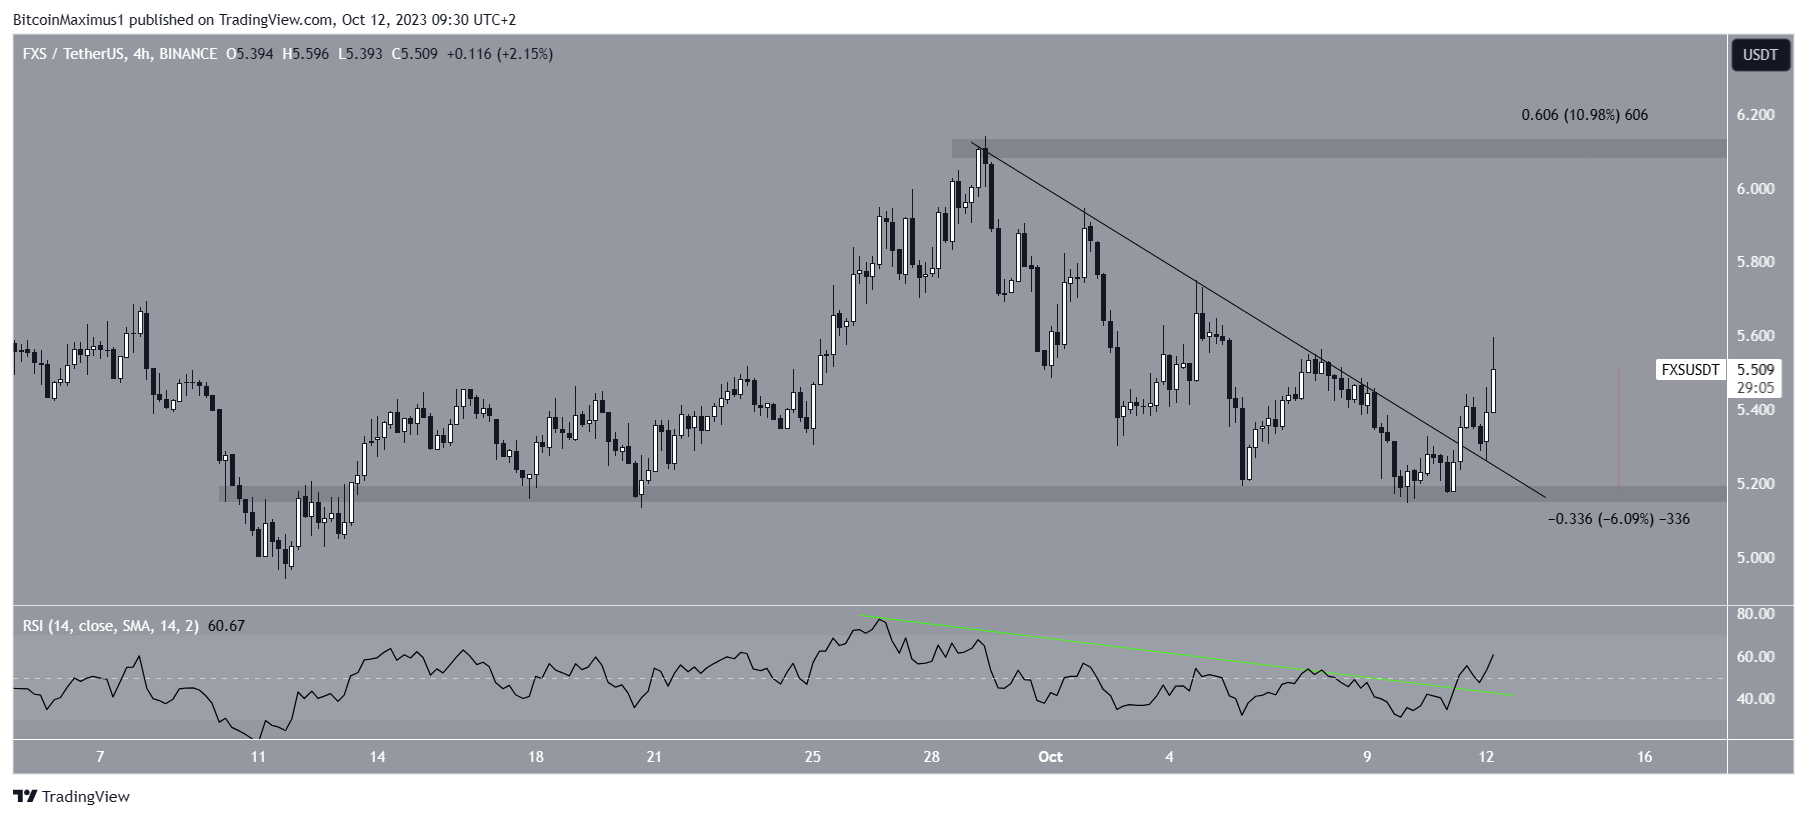
Technical analysis from the shorter-term six-hour timeframe supports the continuation of the FXS price increase. Firstly, the altcoin has broken out from a shorter-term descending resistance trendline, validating the breakout from the longer-term trendline. Secondly, the Relative Strength Index (RSI) has also broken out from its own trendline.
If the upward movement continues, there is potential for an 11% increase in the FXS price, reaching the $6.10 horizontal resistance area. However, failure to sustain this increase could result in a 6% drop to the closest horizontal area at $5.20.

Hot Take: Potential for Growth in Frax Share (FXS) Price
The breakout from long-term resistance and the positive technical indicators suggest that there is potential for further growth in the FXS price. However, it is important to monitor whether the increase can be sustained or if a drop to previous levels is likely. Keep an eye on the $6.10 horizontal resistance area and the $5.20 support level to gauge the future direction of FXS.


 By
By
 By
By

 By
By
 By
By
 By
By