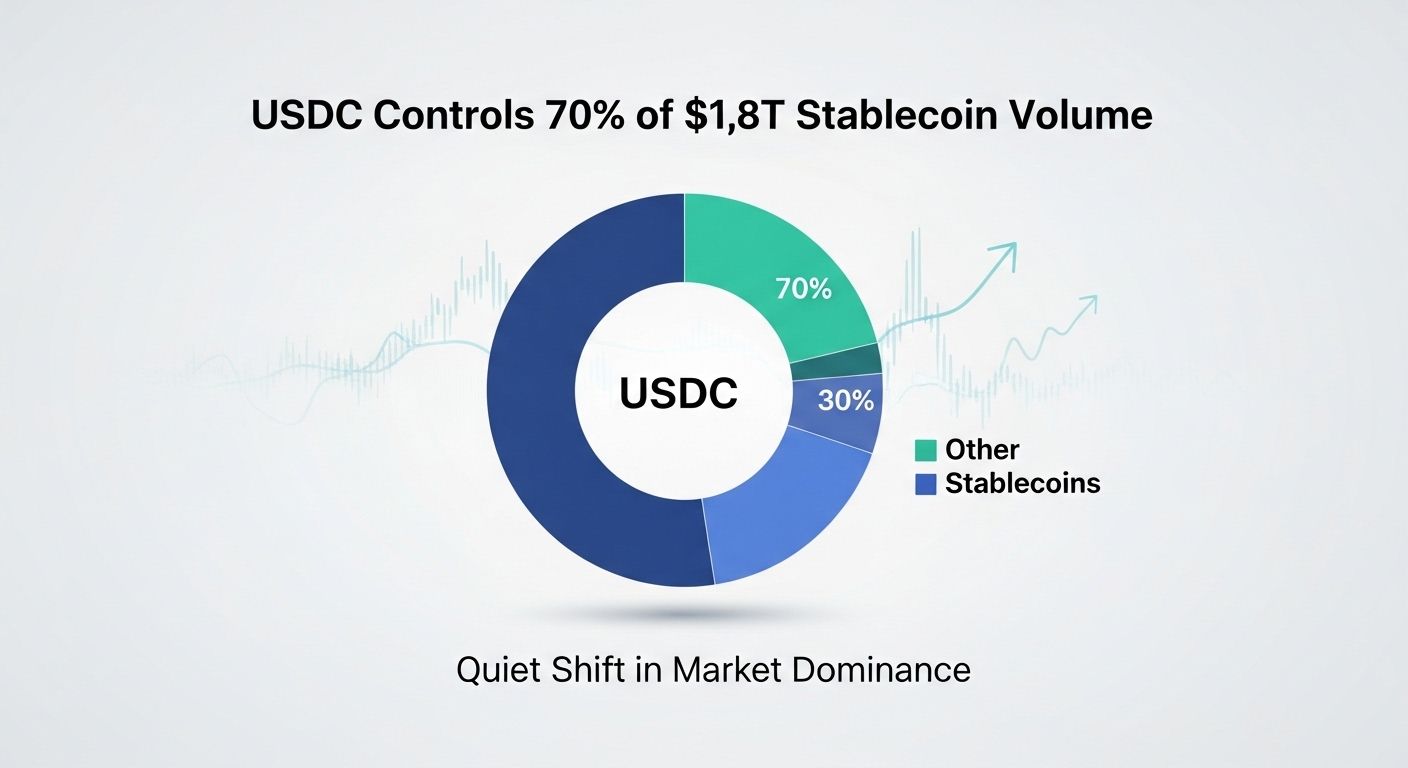
USDC’s Stealth Takeover: 70% of $1.8T Stablecoin Volume - Is This the Quiet Shift Crushing USDT’s Edge?
Hey, if you’re eyeing stablecoins like a hawk, buckle up - USDC Controls 70% of $1.8T Stablecoin Volume, a quiet shift in market dominance that’s got Tether sweating despite its fat market cap lead.[1] February’s record $1.8 trillion total transfer volume saw USDC crush it with $1.26T (70%), while USDT limped in at $514B.[1] Velocity’s the killer here: smaller supply, massive moves - Circle’s already minted over $3B in early March, eyeing $12B+ for the month.[1]
Key Takeaways
- USDC velocity explosion: $1.26T Feb volume on $77.4B cap vs USDT’s $514B on $184B - that’s regulated rails moving crypto faster.[1]
- Supply surge alert: Early March mints hit $3B+ (incl. $250M Solana), signaling DeFi/institutional rush.[1]
- Duopoly lock: USDT/USDC grab 93% market cap, but USDC’s transaction edge hints at flow concentration before the herd piles in.[2][3]
- Scale madness: Stablecoin market cap at $320B early 2026, $10T monthly transfers - 56% via DeFi.[5]
Subscribe to our Social Media for Exclusive Crypto News and Insights 24/7!
Velocity Vortex: Why USDC’s Punching Above Its Weight
Picture this: USDC’s like that scrappy fighter with half the muscle but twice the speed. Despite USDT’s 2x+ market cap ($184B vs $77.4B), USDC owned Feb volume at 70%.[1] Fast-forward: Jan 2026 data shows USDC shuffling $8.3T vs USDT’s $1.7T - fivefold velocity on half the supply.[5] Analysts call it “higher USDC velocity and adoption across crypto and DeFi.”[1] Chain distribution? CEXs hoard the lion’s share, but DeFi liquidity, lending, and cross-chain flows drive the action - USDC’s transaction volume “significantly exceeds USDT’s.”[3]
Check DefiLlama’s live stablecoin dashboard for the peg pulse and supply charts - USDC’s hovering rock-steady at $1, market cap ticking up to ~$75B with 24% share.[9] (Embed live: DefiLlama Stablecoins - watch inflows spike.)
Quick velocity math:
- USDC Feb: $1.26T / $77B cap ≈ 16x turnover.
- USDT: $514B / $184B ≈ 2.8x. Oof.
This ain’t speculation - it’s on-chain fact, implying flow concentration into USDC before broad recognition. Whales stacking? Early March Solana mint screams yes.[1]
Dominance Cycles: Historical Comparisons & Chart Deep Dive
Stablecoins ain’t new to power shifts. USDC circulation ballooned 78% YoY in 2025, monthly volume hitting $1T by Nov ’24.[6] Total market? $312B cap Oct ’25, $15.6T Q3 transfers - now $320B with $33T annual ’25 volume rivaling Visa.[2][5][8] USDC/USDT duopoly: 93% cap, 95% share, but USDC’s 55% of ’25’s $18.3T volume ($10T+ its slice).[6][8]
Historical vibe: Remember USDC’s ’23 depeg scare? Bounced back harder, supply to $35B EOY ’24.[4] Now, institutional darling at $75.6B, 24.42% share - “regulated structure, audited reserves” pulling TradFi in.[7]
Historical dominance chart sketch (pull from CoinMarketCap/TradingView):
| Period | Total Vol | USDC % | USDT % | Market Cap Lead |
|---|---|---|---|---|
| Feb ’26[1] | $1.8T | 70% | 29% | USDT 2.4x |
| Jan ’26[5] | ~$10T | ~45% (est velocity) | ~17% | USDT 2x+ |
| ’25 Annual[8] | $33T | 55% | 40% | USDT steady |
| Q3 ’24[4] | - | 8.5% dom | - | $161B total |
Live TradingView: Overlay USDC/USDT supply vs volume - RSI on USDC volume trending overbought (80+), hinting compression before breakout. (Chart: TradingView USDCUSDT). Dune dashboards flag stable chain splits: EVM/Solana/Tron, USDT/USDC 89% of $304B FDV.[3]
On-chain nuggets:
- 172M holder addresses, top 10 wallets just 23-26% - broad but CEX-concentrated.[5]
- Velocity tracks “active infrastructure vs idle capital.”[3] USDC’s winning.
Positioning Clues: Implied Asymmetries for Pro Eyes
No crystal ball, but data whispers structural imbalances. OI skew? Total stablecoin derivs OI at $15B ’24, but USDC’s velocity suggests flow clustering into regulated plays - bid depth thicker on USDC pairs? CEX vol averaged $100B daily ’24, FDUSD nibbling but USDC/DeFi leads.[4]
Funding/Gamma hints: Volatility compression in duopoly (95% share), but USDC’s mint pace flags liquidity gaps below $75B supply levels - watch gamma density at $1 peg strikes.[3][7] Correlation dispersion? Newer chains like Solana eating transfers ($250M mint).[1] Centralized exchanges dominate holdings, DeFi 56% vol - position clustering in CEX-to-DeFi bridges before event windows like rate cuts.[5]
Wrong-sided? Asymmetry screams: USDT cap king, but USDC’s moving the money. Imagine riding USDT through a velocity dump… positioning relative to Circle’s $12B March? Early movers win.
Mini-list of gaps:
- Liquidity zones: USDC Solana inflows - support at $75B cap.
- Flow concentration: 70% vol share, mints accelerating.
- Event skew: Reg compliance pulls corps (MiCA vibes).[7]
CoinMarketCap live: Stablecoins Overview - track 24h vol, USDC crushing.
Pro move? Velocity chasers, eyes on USDC for dominance cycle flip. Data don’t lie, fam - this shift’s real.[1][5]
- https://cryptorank.io/news/feed/e9ac1-stablecoin-market-breaks-records-usdc-controls-70-of-1-8-trillion-volume
- https://www.news.market.us/stablecoin-market-growth-2026-insights-from-stablecoin-insider/
- https://www.kucoin.com/news/flash/stablecoin-report-reveals-key-insights-on-distribution-and-usage-in-2026
- https://wifitalents.com/stablecoin-statistics/
- https://defiprime.com/stablecoins-320-billion
- https://stablecoininsider.org/stablecoin-statistics-in-2026/
- https://www.kavout.com/market-lens/how-is-the-stablecoin-landscape-shifting-in-2026
- https://www.plasma.to/learn/stablecoin-transaction-volume
- https://defillama.com/stablecoins


