The Dogecoin (DOGE) price recently broke out of a long-term descending resistance trendline but was unable to maintain its upward momentum.
Following the momentum reversal, the price has been trading within a bearish descending triangle pattern.
Dogecoin Fails to Sustain Increase
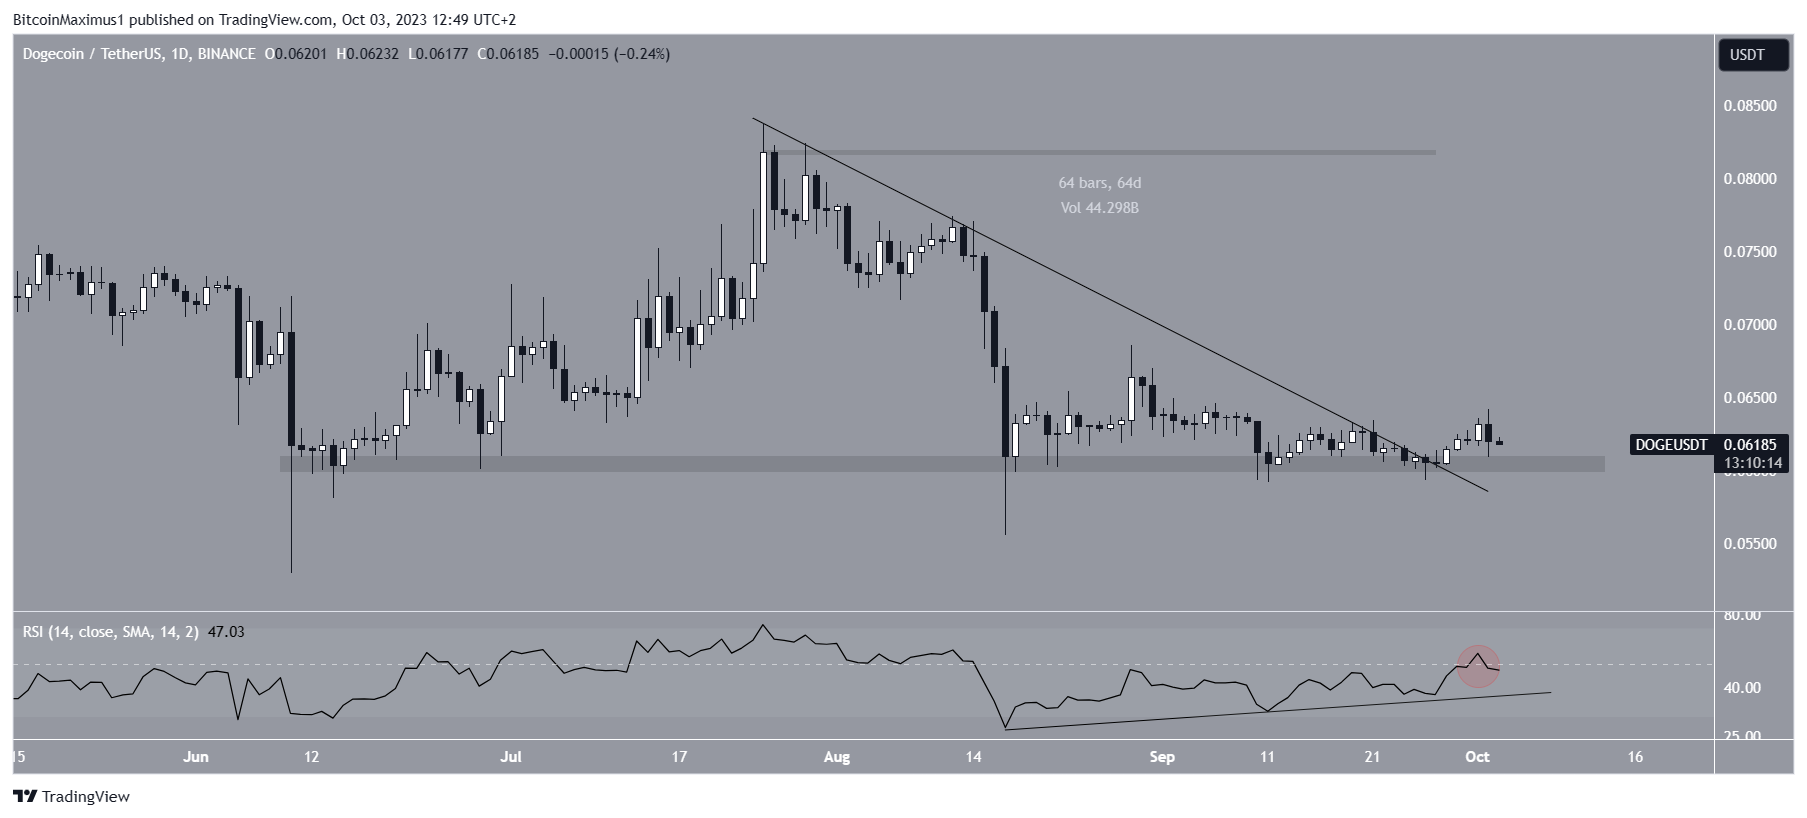
Looking at the daily timeframe, DOGE price broke out of a descending resistance trendline on September 27 after being in place for 64 days. However, instead of experiencing a significant upward movement, the price reached a high of $0.064 before falling.
On October 2, DOGE formed a bearish engulfing candlestick, indicating that the gains from the previous period were negated. Currently, DOGE is trading slightly above the $0.060 horizontal area.

The weekly Relative Strength Index (RSI) indicates a bearish outlook. The RSI is a momentum indicator used by traders to assess whether a market is overbought or oversold and make decisions about buying or selling an asset. Readings above 50 and an upward trend suggest bullishness, while readings below 50 indicate bearishness.
The RSI for DOGE was rejected by 50 and is currently falling, indicating a bearish trend. However, it’s worth noting that the ascending support trendline in the RSI remains intact, which preceded the upward movement that started on August 17.
DOGE Price Prediction: Bearish Pattern Warns of Decrease
In contrast to the daily timeframe, the six-hour timeframe presents a bearish outlook for DOGE. There are two main reasons for this:
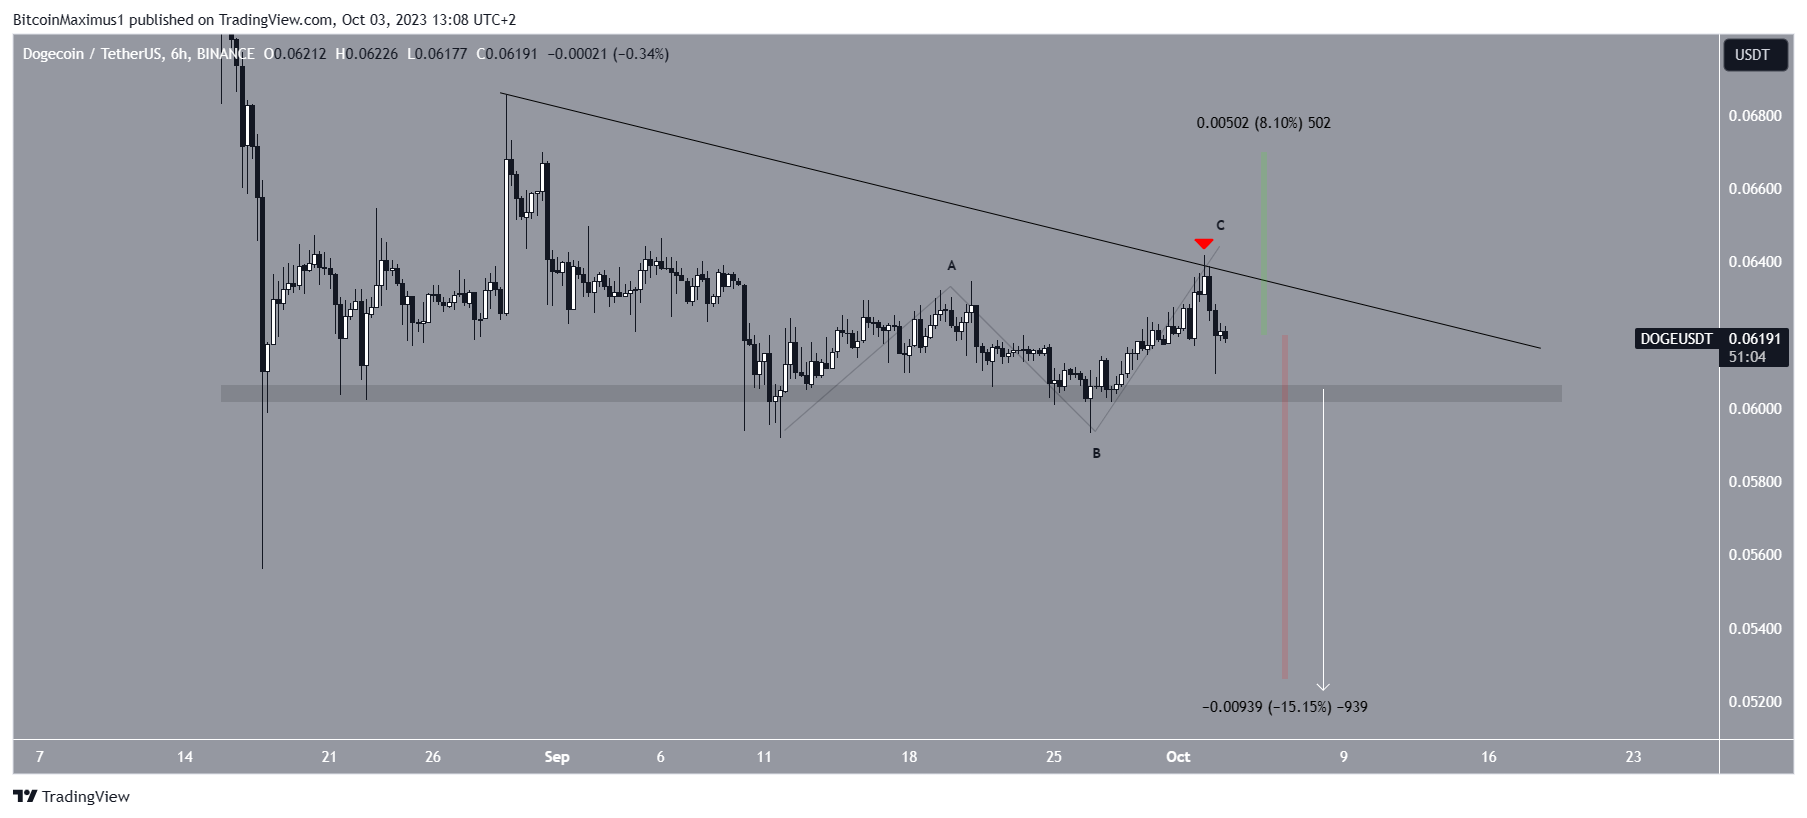
Firstly, DOGE is trading within a descending triangle pattern, which is typically considered bearish and often leads to breakdowns. The rejection on October 2 determines the slope of the resistance trendline.
Secondly, the upward movement within the triangle appears to be a corrective A-B-C pattern, based on Elliott Wave theory. This suggests a bearish trend.
If DOGE breaks down from the triangle, it could potentially drop by another 15% and reach the $0.052 region, based on the height of the triangle projected to the breakdown point.

However, if DOGE manages to break above the resistance trendline of the triangle, it would indicate a bullish trend instead. In that case, the price could potentially increase by 8% and reach the $0.067 resistance level.
Hot Take: Bearish Outlook for DOGE Price
The recent breakout from the descending resistance trendline did not lead to a sustained upward movement for Dogecoin. Instead, it has been trading within a bearish descending triangle pattern. The weekly RSI suggests a bearish outlook, while the six-hour timeframe indicates a potential breakdown from the triangle, leading to a further decrease in price. However, if DOGE manages to break above the resistance trendline of the triangle, it could signal a bullish trend. Overall, the current technical analysis points towards a bearish outlook for DOGE price in the near term.


 By
By
 By
By
 By
By
 By
By
 By
By
 By
By