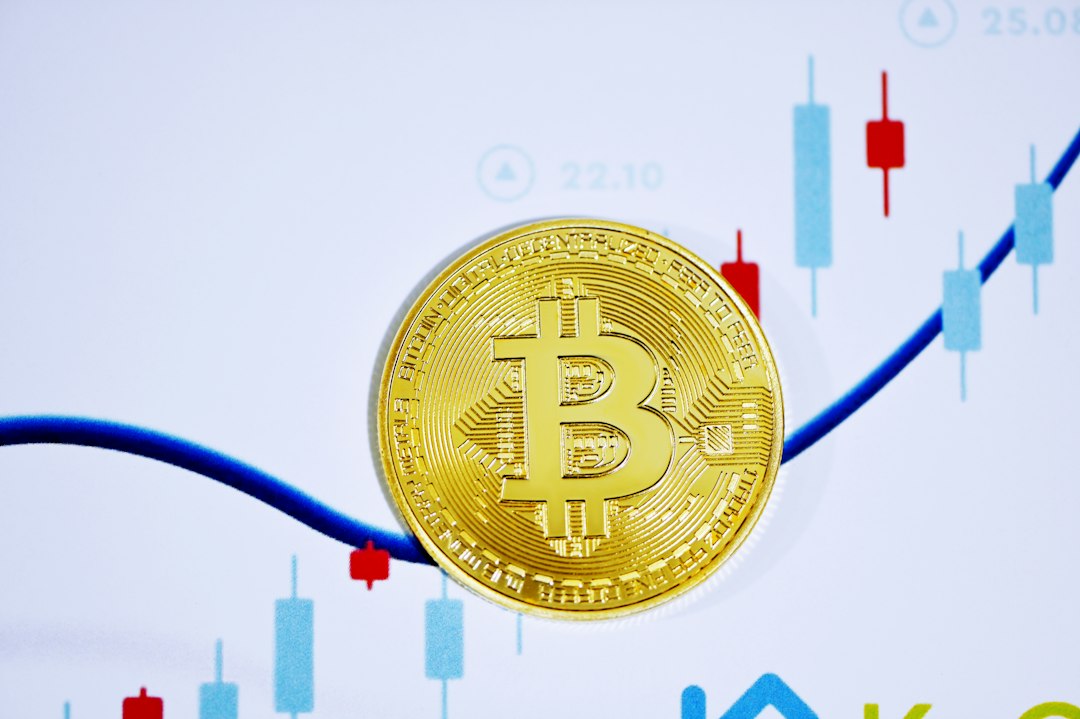
Solana Price Shows Signs of Rally
In recent days, Solana experienced a downward correction, similar to Bitcoin and Ethereum. However, it found support above $65 and is now attempting a fresh increase. The price has surged by almost 10% and is trading above $68 and the 100 simple moving average (4 hours). On the 4-hour chart of the SOL/USD pair, there is a significant bullish trend line forming with support near $65.50.
Possible Decline in SOL?
If SOL fails to surpass the $75 resistance level, it could start another decline. The initial support on the downside is around $68.50. The first major support lies near $65.50 or the trend line. A close below the $63.50 support could lead to a decline towards the $56.00 support in the near future.
Technical Indicators
The MACD for SOL/USD on the 4-hour chart is showing bullish momentum, while the RSI is above the 50 level.
Source: SOLUSD on TradingView.com
Hot Take: Solana Price Poised for Further Rally
Solana’s price has shown resilience in the face of a recent correction and has managed to regain upward momentum. With strong support at key levels and a bullish trend line forming, SOL could rally further above its current resistance levels. However, if it fails to break through these resistance levels, a decline may be imminent. Technical indicators suggest that bullish momentum is building up for SOL/USD. Keep an eye on the $75 resistance level as a potential turning point for the cryptocurrency.


 By
By
 By
By
 By
By

 By
By
 By
By