The Stellar Price Breaks Down from Descending Triangle Pattern
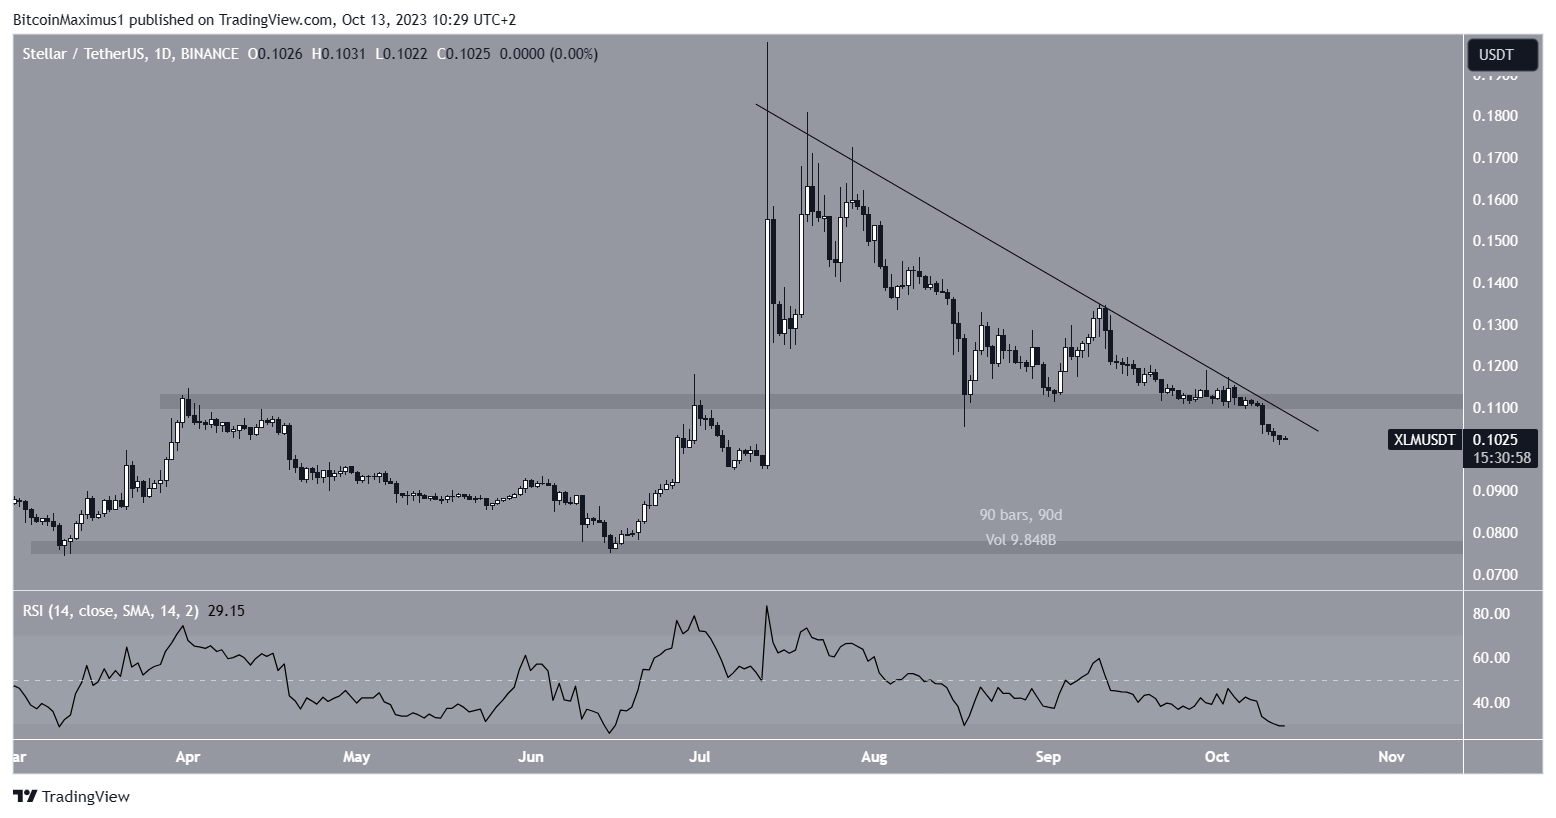
The price of Stellar (XLM) has recently broken down from a long-term descending triangle pattern that it had been trading within since July 13. This breakdown raises the question of whether we can expect further decline in the XLM price.
Stellar Falls Below Long-Term Support
When analyzing the daily time frame for XLM, we can see a continuous downward movement since July 13. Throughout this period, the price has consistently fallen below a descending resistance trendline, forming a bearish descending triangle pattern.
On October 9, the Stellar price broke down from the $0.110 area, with a daily close below the $0.110 horizontal support area. Since then, it has reached a new 90-day low of $0.101 on October 12.
The daily RSI indicator is currently bearish, indicating a downward trend in the XLM price.

Stellar Development Foundation and Certora Introduce Security Support for Soroban
In other news, Stellar Development Foundation and Certora have introduced advanced security support for Soroban, the smart contract platform on the Stellar network. This marks the first time Certora’s backing has been extended to a WebAssembly (WASM) – powered platform like Soroban.
XLM Price Prediction: Where Will Breakdown Lead To?
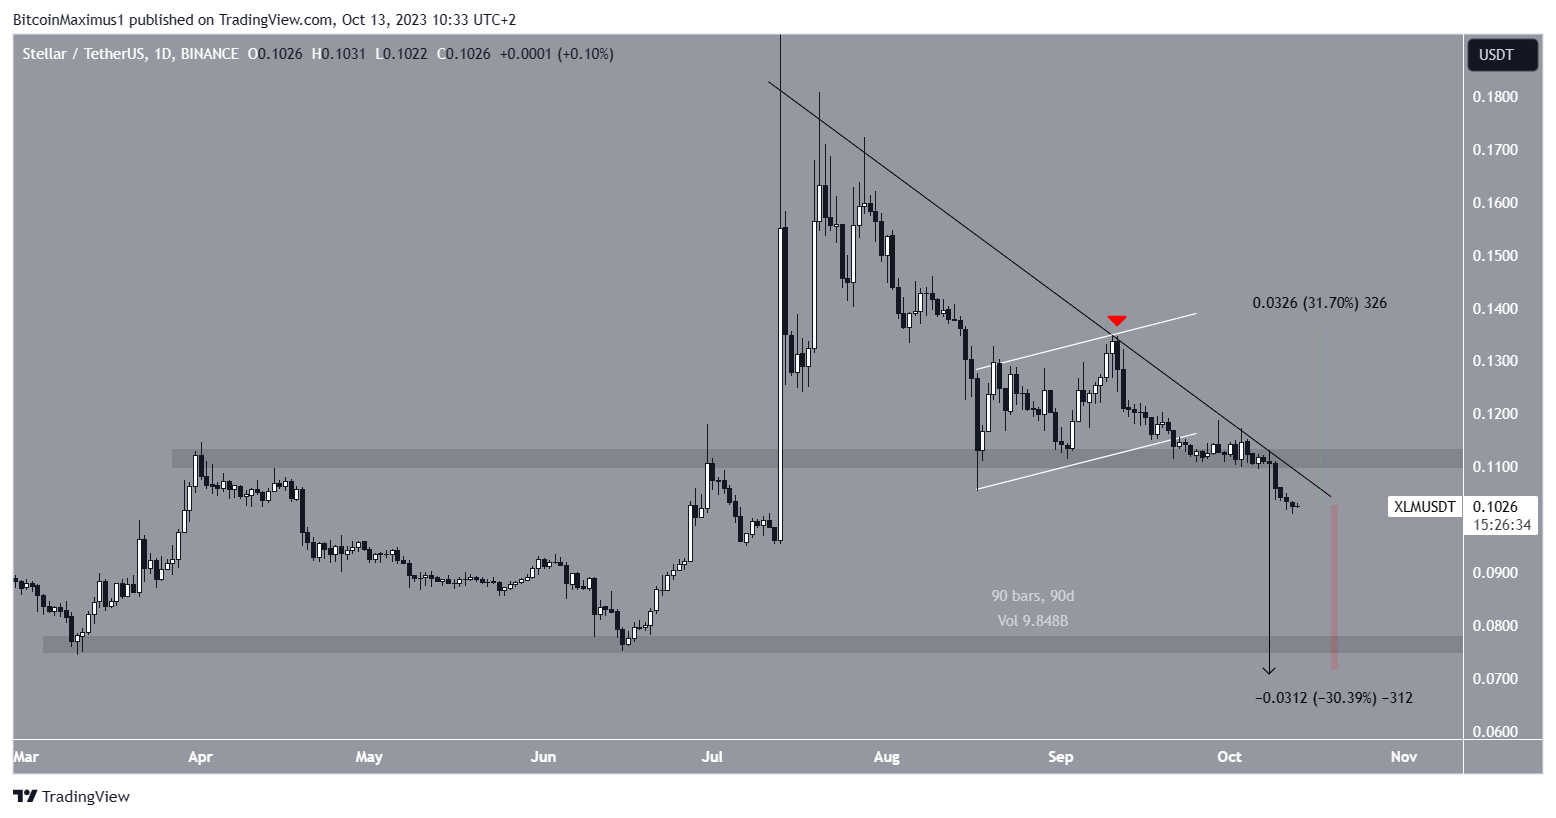
One contributing factor to the breakdown could be the ascending parallel channel within the triangle. As channels contain corrective movements, it was expected that the upward movement inside the channel would eventually reverse and lead to a drop.
If the price continues to decrease, it could reach just below the $0.076 horizontal support area, resulting in a 30% decrease from the current price.

However, if there is a breakout from the triangle’s resistance trendline, it would invalidate the previous breakdown and indicate a bullish trend. In this scenario, XLM could potentially increase by 30% to $0.140.
Hot Take: Uncertain Future for Stellar (XLM) Price
The recent breakdown from the descending triangle pattern raises concerns about the future of Stellar’s price. With ongoing bearish indicators and the potential for further decline, it is crucial to closely monitor the XLM price movement. Additionally, the introduction of advanced security support for Soroban on the Stellar network may bring new opportunities for XLM, but its impact remains uncertain. Traders and investors should stay informed and adapt their strategies accordingly to navigate the current market conditions.


 By
By
 By
By
 By
By
 By
By
 By
By
 By
By