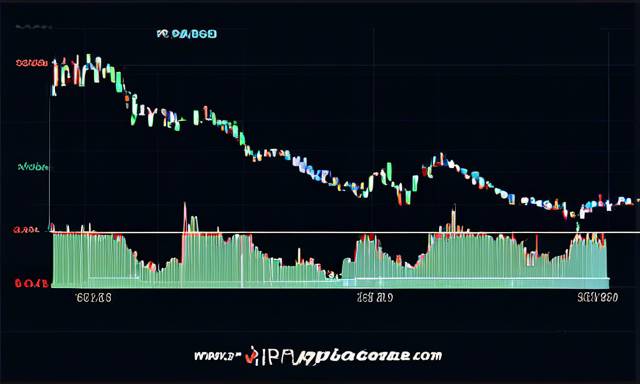
Overview of XRP Price Movements 📈
For the crypto reader, XRP is currently navigating fluctuations within key price ranges as it attempts to recover from recent market dynamics. The coin has seen movement above certain thresholds, suggesting potential for upward momentum should it break critical resistance levels. This year, traders are particularly attuned to XRP’s performance, especially in light of its correlations with Bitcoin and Ethereum. Strategies for both short-term gains and long-term positions may hinge on XRP’s ability to maintain its current trajectory.
XRP Price Aims for Upward Breakthrough 🚀
XRP has embarked on a recovery trend, surpassing the $0.5220 mark following similar patterns exhibited by Bitcoin and Ethereum. The price successfully cleared the resistance levels at $0.5250 and $0.5320, indicating a robust recovery phase.
Ultimately, XRP surged toward the $0.5420 level before encountering bearish resistance. A peak was reached at approximately $0.5426, leading to subsequent corrections. This dip took the price below the $0.540 threshold and the 23.6% Fibonacci retracement point, which tracks the upward movement from the $0.5021 low to the $0.5426 high.
Additionally, a break occurred beneath a critical bullish trend line, which had support around the $0.540 area as shown on the hourly chart of the XRP/USD pair. Currently, XRP trades above $0.5320 and remains above the 100-hour Simple Moving Average, suggesting some signs of strength.
Resistance Ahead 🛑
Looking upward, XRP may confront substantial resistance near the $0.5400 zone. The first significant resistance point rests at $0.5420, while the next pivotal level is positioned around $0.5450.
- A successful ascent above the $0.5450 barrier could propel prices toward the $0.5550 mark.
- Significant resistance may also appear at $0.5720.
- Should momentum facilitate further gains, XRP might approach the $0.5950 resistance or even touch $0.600 in the upcoming period.
Potential Decline? 📉
Should XRP struggle to overcome the $0.540 resistance level, it may signal the start of another downturn. Immediate support can be found at the $0.5320 threshold and along the 100-hour Simple Moving Average. The next central support level appears at $0.5225, which aligns with the 50% Fibonacci retracement of the earlier upward movement.
In the event of a downward breach and closure below the $0.5225 mark, XRP could face continued declines toward the $0.5110 support in the short term, while the next significant support level stands at $0.5020.
Technical Analysis 📊
- Hourly MACD: The MACD for XRP/USD indicates a loss of upward momentum, suggesting a weakening bullish sentiment.
- Hourly RSI (Relative Strength Index): Currently, the RSI for XRP/USD falls below the 50 threshold, hinting towards potential consistency in bearish tendencies.
- Major Support Levels: $0.5320 and $0.5225.
- Major Resistance Levels: $0.5400 and $0.5420.
Hot Take 🔥
For the reader engaged in the crypto landscape, the performance of XRP in the forthcoming days will be pivotal. Observing key resistance and support levels can provide insights into market behavior. Moving ahead, analysts will closely monitor price actions around these critical thresholds, as they could dictate the asset’s trajectory. This year holds potential for both challenges and opportunities, and remaining attuned to these changes may aid in navigating this dynamic market.
- XRP price could gain pace for a move above the $0.5420 resistance zone.
- The price is now trading above $0.5320 and the 100-hourly Simple Moving Average.
- There was a break below a connecting bullish trend line with support at $0.540 on the hourly chart of the XRP/USD pair (data source from Kraken).
- The pair could gain bullish momentum if it clears the $0.5420 and $0.5450 resistance levels.


 By
By

 By
By


 By
By